

Instagram has 3 billion monthly active users, a 33.3% majority aged 25–34, and 60% of American users earning over $100K per year — yet most marketers are still building targeting strategies on outdated 2023 data. This tutorial walks you through every demographic layer that matters in 2026, and shows you exactly how to apply each data point to your organic strategy, paid campaigns, and content calendar.
What This Is
The annual Hootsuite Instagram Demographics report, published March 30, 2026, aggregates platform data, third-party research, and behavioral analytics to build the most complete picture of who is actually on Instagram — and how they’re using it. This isn’t a feel-good overview; it’s a structured dataset covering age distribution, gender splits, geographic concentration, household income brackets, education levels, time-on-platform statistics, and content preference signals.
The platform itself has crossed a meaningful threshold: 3 billion monthly active users (MAUs), tying with WhatsApp for third place globally among social platforms. That number sounds abstract until you layer in the behavioral context from the 2026 Instagram Strategic Outlook research report: organic engagement is down 24% year-over-year, the average engagement rate across all formats sits at 0.48%, and the platform’s algorithmic architecture is now fully delegated to Meta’s AI engines — Andromeda, GEM, and Lattice.
What you’re dealing with in 2026 is a platform that’s simultaneously more powerful and more demanding. More powerful because the audience is larger, richer, and more purchase-ready than ever. More demanding because the AI infrastructure means you can no longer hand-tune your way to reach — you have to feed the algorithm the right creative inputs and let it work. That shift reframes how demographics matter. Previously, demographics told you who to target. In 2026, they tell you what to create.
Here’s what the data actually says about the Instagram audience today:
- Age: The 25–34 bracket owns 33.3% of the platform. Add the 18–24 cohort (29.7%) and you have 63% of all Instagram users under 35. The 35–44 group holds another 17.4%. Only 8.8% of users are 55 or older.
- Gender: In the U.S., 55% female to 44% male. Globally, it’s nearly 50/50. India skews heavily male at 67.2%.
- Geography: India leads with 392 million users, followed by the U.S. at 172 million and Brazil at 141 million.
- Income: 60% of American users earn over $100K household income. Even the lower tiers are substantial: 54% earn $70K–$99K, and 46% earn $30K–$69K.
- Education: 58% of U.S. users hold a college degree or higher.
- Usage Intensity: The average user opens the app 331.8 times per month and spends 16 hours and 13 minutes on it. Turkey leads globally at 32 hours 36 minutes and 581.5 monthly opens.
These aren’t vanity metrics. They’re the inputs that determine whether your campaign brief, your creative strategy, and your audience configuration are grounded in reality or assumption.
Why It Matters
The demographic profile of Instagram in 2026 should be rewriting your entire strategy — and for most teams, it isn’t. Here’s why it matters at a practical level.
The 25–34 cohort is your primary conversion audience. This group represents 33.3% of all users and sits at peak purchasing power. They have disposable income, they use the platform actively (remember: 331.8 opens per month average), and 62.3% of them are already there explicitly to follow or research brands. If your creative is targeting 18–24-year-olds by default — because that feels like “Instagram’s audience” — you are leaving significant revenue on the table.
The income data changes your CPC math. When 60% of your U.S. audience earns $100K or more, Instagram’s cost-per-click math looks very different than it does on platforms skewed toward lower income brackets. The cost to reach a qualified buyer is lower than it appears. Brands selling premium products, SaaS tools, professional services, or considered-purchase items have an outsized opportunity here that most are not pricing into their media plans.
AI-driven targeting shifts demographics from targeting inputs to creative inputs. According to the 2026 Strategic Outlook, Meta’s AI engine Andromeda “reads” ad creative — visuals, copy, themes — to determine which users should see the ad. GEM then fine-tunes delivery based on real-time behavioral signals. This means your targeting configuration matters less than the signals embedded in your creative. If you want to reach 28-year-old female professionals with disposable income, you don’t segment for them — you create content that resonates with them and let Andromeda find them. Demographics now serve as a briefing input for your creative team, not a field in Ads Manager.
The 63% teen penetration rate matters for long-horizon brands. U.S. teenagers are on Instagram at a 63% adoption rate. For consumer brands building category awareness with the next generation of buyers, this is the proof point that Instagram is not aging out — it’s aging in.
Private engagement is replacing public engagement. As Chloe Maguire, Brand & Social Media Lead at Leapsome, notes in the research report: “Engagement hasn’t disappeared, it’s evolved.” Saves, shares, and DMs are replacing likes as the primary signal of content value. Reels are shared more than 4.5 billion times daily. When you understand who your audience is, you can design specifically for the “forward to a friend” behavior that’s now the real organic distribution engine.
The Data: 2026 Instagram Demographics Benchmarks
All data sourced from Hootsuite Instagram Demographics 2026 and the 2026 Instagram Strategic Outlook.
Age Distribution
| Age Group | Share of Platform | U.S. Adult Usage Rate |
|---|---|---|
| 18–24 | 29.7% | 76% |
| 25–34 | 33.3% | (largest segment) |
| 35–44 | 17.4% | — |
| 45–54 | 9.7% | — |
| 55–64 | 5.3% | — |
| 65+ | 3.5% | — |
U.S. Household Income Profile
| Income Bracket | % of U.S. Instagram Users |
|---|---|
| $100,000+ | 60% |
| $70,000–$99,999 | 54% |
| $30,000–$69,999 | 46% |
| Under $30,000 | 41% |
Content Format Performance (Organic)
| Content Format | 2024 Engagement Rate | 2026 Engagement Rate | YoY Change |
|---|---|---|---|
| Carousels | 0.55% | 0.55% | Steady |
| Reels | 0.50% | 0.52% | +4% |
| Static Images | 0.45% | 0.37% | -17% |
Top Geographic Markets
| Country | Monthly Active Users |
|---|---|
| India | 392 million |
| United States | 172 million |
| Brazil | 141 million |
| Indonesia | 90 million |
Influencer Tier Engagement
| Influencer Tier | Engagement Rate |
|---|---|
| Nano (under 10K) | 6.23% |
| Platform Average (all formats) | 0.48% |
Step-by-Step Tutorial: Build a Data-Driven Instagram Strategy From Demographics
This is how you turn a demographic report into a working campaign brief and content calendar. Follow these steps in sequence.
Phase 1: Audit Your Current Audience Assumptions
Step 1: Pull your actual audience data from Instagram Insights.
Go to your Instagram Professional Dashboard → Audience → then document: age distribution, gender split, top cities, top countries, and most active times. Screenshot or export this. You’re going to compare it against the platform-wide 2026 benchmarks.
Step 2: Score the gap.
Create a simple comparison table in a spreadsheet:
| Dimension | Platform Benchmark (2026) | Your Audience | Gap |
|---|---|---|---|
| Primary age group | 25–34 (33.3%) | Your data | +/- |
| Gender split (U.S.) | 55F / 44M | Your data | +/- |
| Top market | India / U.S. / Brazil | Your data | +/- |
If your primary audience skews significantly older than 25–34, you either serve an older market (legitimate) or you’ve been accidentally optimizing content for the wrong demographic. The gap tells you whether your audience is who you think it is.
Step 3: Define your target demographic persona.
Based on your audit, write a one-paragraph audience persona that includes: age bracket, gender, geography, income assumption (use the platform benchmarks as a floor), and behavioral signal (what would make them save, share, or DM this content). This persona drives every decision in the steps below.
Phase 2: Translate Demographics Into Content Format Decisions
Step 4: Map your persona to the right format.
Use the format performance data from the 2026 Strategic Outlook to match content type to audience goal:
-
Carousels: Best for 25–34 professionals seeking educational or utility content. Engagement rate is steady at 0.55% — the only format holding flat in a declining market. Use carousels for how-to content, data breakdowns, product comparisons, or multi-step tutorials. The “double exposure” mechanic (Instagram resurfaces the carousel to non-engagers showing a different slide) makes this your best organic distribution asset.
-
Reels: Best for 18–24 and 25–34 audiences you want to reach beyond your existing follower base. Reels account for 46% of all time spent on the app and must stay under 3 minutes to qualify for recommendation to non-followers. Use Reels for brand discovery, product demonstrations, and content that’s designed to be shared (remember: 4.5 billion shares per day globally).
-
Static Images: Use sparingly. Engagement dropped 17% year-over-year to 0.37%. Reserve static images for real-time event coverage or brand-narrative posts where the visual stands alone without requiring video production. Do not build a static-image-heavy organic strategy in 2026.
Step 5: Write a format allocation plan.
A practical starting allocation for most B2C and B2B brands targeting the 25–34 primary demographic:
- 40% Carousels (authority, education, saves)
- 40% Reels (discovery, shares, reach)
- 20% Static Images (event coverage, real-time, narrative support)
Adjust based on your Insights data. If your audience skews 35–44, lean more heavily on Carousels. If you’re targeting 18–24, increase the Reels allocation.
Phase 3: Configure Paid Targeting Using Demographics as Creative Inputs
Step 6: Resist narrow audience segmentation.
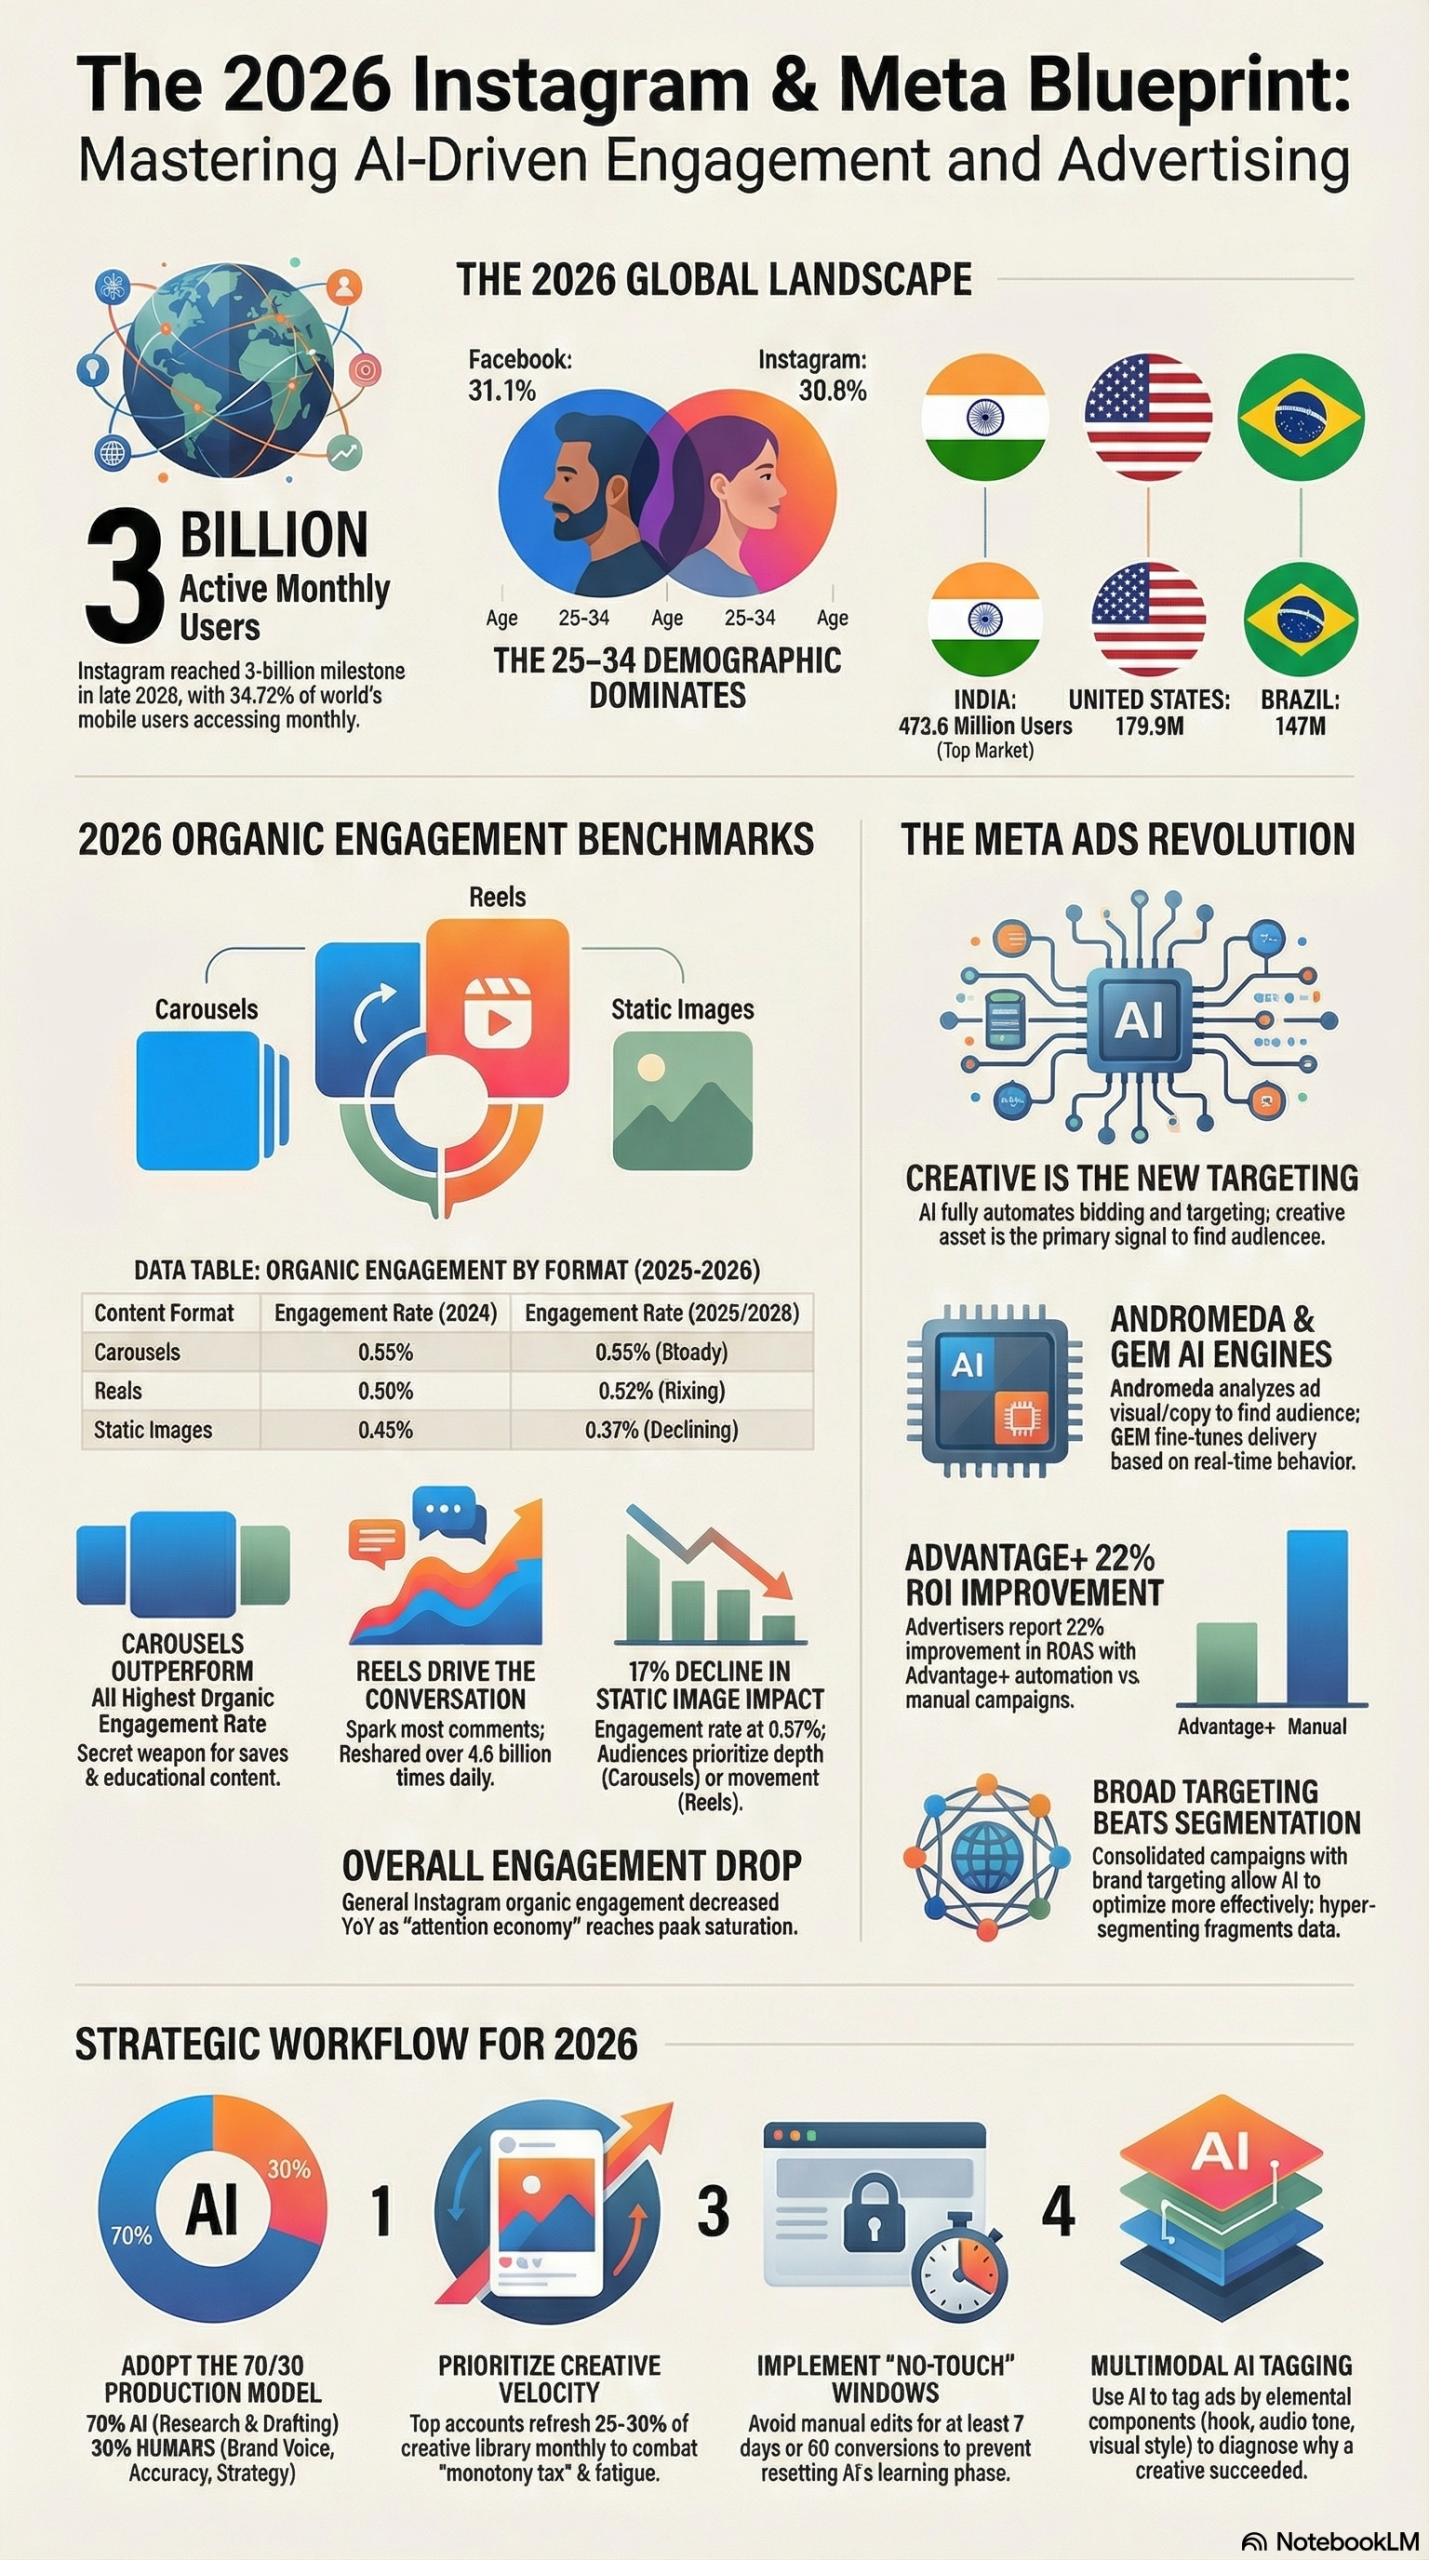
Per the 2026 Strategic Outlook, Meta’s AI systems — Andromeda and GEM — perform better with broader targeting. Narrow audience segments restrict the AI’s optimization surface. Instead of building tightly segmented custom audiences, set broad parameters (age range, country) and use your demographic knowledge to inform the creative, not the targeting fields.
Step 7: Brief your creative team using the income and education data.
The fact that 60% of U.S. Instagram users earn $100K+ and 58% hold a college degree has direct creative implications:
- Avoid condescending explanations. This audience is sophisticated.
- Lead with value and outcome, not feature lists.
- High-quality production signals trust. Grainy, off-brand creative underperforms with a high-income demographic.
- Price anchoring works differently. Don’t lead with discounts to an audience that responds to quality and utility.
Write this into your creative brief explicitly: “Our audience earns $100K+, holds a college degree, and uses Instagram 331 times per month. Brief accordingly.”
Step 8: Implement Conversion API (CAPI) alongside your Pixel.
If you’re running paid campaigns, this is non-negotiable in 2026. According to the 2026 Strategic Outlook, businesses using both Pixel and CAPI see 24% more attributed conversions than Pixel-only setups. CAPI sends server-side events directly to Meta, bypassing browser-level tracking limitations. Set this up through your Meta Business Manager → Events Manager → Add New Data Source → Conversions API.
Phase 4: Localize for High-Value Geographic Markets
Step 9: Build market-specific content for India, U.S., and Brazil.
India has 392 million Instagram users — the largest market globally. The U.S. follows at 172 million, Brazil at 141 million. If you’re running global campaigns without market-specific creative, you’re treating three distinct behavioral and cultural contexts as interchangeable. At minimum:
- Create locale-specific caption copy (translated, not auto-translated)
- Adjust posting times for local peak activity
- For India campaigns: note the 67.2% male skew — your creative gender assumptions need to shift
Step 10: Apply hyperlocal tactics for local businesses.
For businesses operating in a single city or region, the 2026 Strategic Outlook recommends “Hyperlocal Visual Content” — recognizable local landmarks, real customer moments, community references. This builds the trust signal that earns DM shares and saves, which are the organic distribution currency of 2026.
Phase 5: Measure the Right Metrics
Step 11: Retire engagement rate as your primary KPI.
With the platform average at 0.48% and declining, chasing engagement rate as a headline metric is measuring a declining signal. Switch your primary measurement to:
- Saves per post (intent to return = high-value audience action)
- Shares and DMs (forward-to-friend = organic distribution)
- Follower growth rate vs. account size benchmark (small accounts 1–5K should see ~22%, large accounts 100K–1M average ~11%)
- Attributed conversions via CAPI (the real business outcome)
Step 12: Run a monthly creative fatigue audit.
Top-performing accounts refresh 25–30% of their creative library monthly, per the 2026 Strategic Outlook. Set a recurring calendar reminder on the first of each month: pull your top 5 ads by spend, check frequency against your target audience, and retire any creative with frequency above 4 for cold audiences. Replace with new variations — AI tools can generate 50 creative variations in 60 seconds, making this operationally straightforward.
Expected Outcome: After 30 days of following this framework, you should see: higher save rates on carousel content, improved Reel reach to non-followers, better CAPI-attributed conversion data, and a content calendar that’s explicitly mapped to documented audience demographics rather than gut instinct.
Real-World Use Cases
Use Case 1: Premium DTC Brand Targeting High-Income Millennials
Scenario: A direct-to-consumer skincare brand selling at $80–$150 price points wants to grow Instagram-attributed revenue in the U.S.
Implementation: Using the 60% $100K+ income benchmark, the brand restructures its creative brief away from discount-led messaging toward outcome and ritual storytelling. They build a carousel series showing the “before and after routine” format — 7-slide carousels designed for saves. For paid media, they set broad age targeting (22–40, U.S.) and let Andromeda identify the highest-intent users based on creative resonance. CAPI is implemented to capture purchase events server-side.
Expected Outcome: Higher average order value (the audience isn’t price-shopping), improved ROAS from AI-optimized delivery, and a save rate above 1% on carousel content indicating strong educational value.
Use Case 2: B2B SaaS Company Reaching Professional Decision-Makers
Scenario: A project management SaaS wants to use Instagram to reach the 25–34 and 35–44 professional segments who represent their buyer persona.
Implementation: The demographic data confirms the audience exists: 25–34 is the platform’s largest cohort, 58% have college degrees, and 60% earn $100K+. The company builds a Reels series featuring 60-second product walkthroughs and “day in the life” customer stories. Carousels cover comparison content (their tool vs. alternatives) designed to earn saves. They target broadly — no job title targeting, no firmographic overlays — and trust Andromeda to surface the content to professional users based on behavioral signals.
Expected Outcome: Lower cost-per-lead than LinkedIn (lower CPMs), improved demo request volume, and carousel saves as a leading indicator of purchase intent.
Use Case 3: Local Restaurant Chain Building Community in U.S. Cities
Scenario: A regional restaurant group wants to build Instagram presence across 12 U.S. markets.
Implementation: Applying the hyperlocal visual content approach from the 2026 Strategic Outlook, each location gets a market-specific content calendar featuring recognizable local landmarks, staff features, and real customer moments. Carousels are used for “behind the menu” storytelling. Reels showcase food preparation and atmosphere. Hashtag strategy follows the 3–5 hashtag optimal range — not the 30-hashtag spam approach. Local geo-tags on every post.
Expected Outcome: Higher DM volume (local discovery), stronger follower growth rates (small account benchmark: ~22% annually), and organic shares from customers tagging the locations.
Use Case 4: Media Brand Capturing the Teen News Audience
Scenario: A digital news publisher wants to reach U.S. teenagers increasingly using Instagram for news consumption.
Implementation: Per Hootsuite’s data, 20% of U.S. adults get news from Instagram — up 9% since 2020 — and 63% of U.S. teenagers are active on the platform. The publisher builds a dedicated Instagram channel with Reels covering breaking news in 90-second explainer format and carousels for data-driven story breakdowns. Content is designed for sharing — the “forward to a friend” mechanic that’s now the primary organic distribution channel.
Expected Outcome: Follower growth among 18–24 demographic, high share rates on Reels, and carousel saves on data story content.
Use Case 5: Influencer Marketing Agency Optimizing Nano-Influencer Campaigns
Scenario: An agency managing influencer campaigns for CPG brands wants to improve engagement rates on paid partnerships.
Implementation: The Hootsuite demographics data shows nano-influencers (under 10K followers) achieve a 6.23% engagement rate — dramatically outperforming the platform average of 0.48%. The agency restructures its influencer roster away from mega-influencers toward networks of 50–100 nano-influencers per campaign. Each creator is matched to the brand’s target demographic using Instagram Insights verification. Creative briefs specify carousel or Reels format (not static images) and include the 3–5 hashtag guideline.
Expected Outcome: 6%+ engagement rates per creator post versus the sub-1% typical of macro-influencer campaigns, stronger save rates, and CPG brands seeing higher earned media value per dollar spent.
Common Pitfalls
1. Using Demographic Data to Narrow Paid Targeting
The most common mistake: taking the 25–34 benchmark and creating a tight audience segment in Ads Manager. In 2026, this backfires. Meta’s AI systems — Andromeda, GEM, and Lattice — need broad audiences to optimize effectively, per the 2026 Strategic Outlook. Narrow targeting literally constrains the AI. Use demographics to brief your creative team, not to build hyper-segmented custom audiences.
2. Building a Static-Image-Heavy Content Calendar
Static image engagement dropped 17% year-over-year to 0.37%, per the 2026 Strategic Outlook. Teams still producing 3–4 static posts per week are running a declining-asset strategy. Audit your content mix and reallocate production budget toward Carousels and Reels. Static images are not dead — they’re situational.
3. Ignoring the India Market Demographic Skew
If you’re running global Instagram campaigns, treating India (392 million users, 67.2% male skew) with the same creative as the U.S. (55% female) will produce misfired messaging. Gender creative assumptions need to be market-specific. Build market variants, not global catch-all creative.
4. Measuring Success With Raw Engagement Rate
With the platform average at 0.48%, using engagement rate as your primary performance signal means you’re measuring a structurally declining metric. Teams that optimize for saves, shares, and DMs — the private engagement signals that have replaced public engagement — will build more durable organic performance.
5. Skipping CAPI Implementation
If you’re running paid Instagram campaigns without Conversion API, you are under-reporting your results by approximately 24%, per the 2026 Strategic Outlook. This directly impacts budget decisions, reporting to stakeholders, and optimization signals fed back to Meta’s AI. This is a technical setup issue with a clear fix — implement it.
Expert Tips
1. Use the “Double Exposure” Carousel Mechanic Deliberately
Instagram resurfaces carousels to users who didn’t engage initially, showing them a different slide. This means your carousel’s second and third slides are as strategically important as the first. Engineer your carousel structure so that any entry point — slide 1, slide 2, or slide 3 — delivers immediate value and drives a scroll. Most teams design their first slide and treat the rest as supporting content. Reverse that instinct.
2. Brief Andromeda, Not the Audience Manager
Segwise AI analysis in the 2026 Strategic Outlook puts it plainly: “Creative is the last lever.” By 2026, creative quality and strategy are the single most controllable input in your paid campaigns. Write your creative briefs as if you’re programming an AI to identify your target audience through visual and copy signals. Ask: what does a 28-year-old earning $100K who saves educational content look like in image and copy form? Make that the brief.
3. Adopt the 70/30 AI Production Model
High-performing teams are using AI for 70% of production — research, first drafts, asset variation — and applying human oversight for the final 30%: brand voice, factual accuracy, unique insights, per the 2026 Strategic Outlook. This isn’t about replacing creative staff; it’s about dramatically increasing output volume without proportionally increasing costs. The creative fatigue metric (refresh 25–30% monthly) requires volume. The 70/30 model makes that sustainable.
4. Treat Saves as Your Organic Conversion Metric
A save is a user telling the algorithm “I want to return to this.” It is the highest-intent organic action available on the platform. Track saves per post explicitly in your content reporting. A carousel with a 1%+ save rate on a 10K-follower account is outperforming the platform average by a significant margin. Design specifically for saves: “bookmark this for later,” tutorial content, reference material, comparison frameworks.
5. Align Posting Strategy with the 331-Opens-Per-Month Behavior Pattern
The average Instagram user opens the app 331.8 times per month — roughly 11 times per day. This is not a platform people check once a day. It is a continuous ambient experience. This changes how you think about posting frequency and timing. Daily posting (or near-daily) is justified by the behavioral data. Posting frequency anxiety is misplaced — your audience is opening the app far more often than you’re posting.
FAQ
Q: Is Instagram still worth investing in for B2B brands in 2026?
Yes, with the right creative approach. The 58% college-educated, 60% $100K+ income profile aligns with B2B decision-maker demographics. The key shift is format: B2B brands perform best with educational carousels (for saves and authority) and product/team Reels (for discovery). The 25–34 age cohort — 33.3% of the platform — includes a significant share of professional buyers and mid-level managers. The audience is there. The question is whether your creative is built for them.
Q: How many hashtags should I actually use in 2026?
Three to five, per the 2026 Strategic Outlook. Despite the platform’s 30-hashtag maximum, data shows that 3–5 hashtags outperform larger tag sets for both reach and SEO. Use specific, relevant hashtags — not broad vanity tags like #marketing (too competitive) or ultra-niche tags with under 10K posts (too small). Target hashtags with 100K–2M posts for the best discoverability ratio.
Q: How much of Instagram’s ad targeting should I control manually in 2026?
Less than you think. Meta’s AI systems (Andromeda, GEM, Lattice) are designed to perform better with broader targeting input. Per the 2026 Strategic Outlook, manual audience narrowing limits AI optimization. Set broad age and geographic parameters, implement CAPI for clean conversion data, and invest your strategic effort in creative quality and briefing. Manual targeting optimization is becoming a legacy skill.
Q: How do nano-influencers compare to macro-influencers for engagement?
The gap is stark. Hootsuite’s 2026 data shows nano-influencers (under 10K followers) achieve a 6.23% engagement rate. The platform average across all formats is 0.48%. That’s a 13x difference. For CPG, lifestyle, and community-focused brands, a network of nano-influencers will consistently outperform a single macro-influencer deal on pure engagement economics. The tradeoff is management complexity — coordinating 50 nano-influencers is more operationally intensive than one macro deal.
Q: Is the teenage audience on Instagram growing or declining?
Growing. 63% of U.S. teenagers are active on Instagram in 2026, and the platform is projected to grow at 3.55% in 2026. Despite competition from TikTok and YouTube, Instagram retains significant teenage penetration, particularly for visual and aesthetic content. For brands building category awareness with younger consumers, this demographic data refutes the narrative that Instagram is aging out of teen relevance.
Bottom Line
Instagram’s 2026 demographic profile tells a clear story: a 3 billion-user platform concentrated in the 25–34 age bracket, with a high-income, well-educated U.S. audience and explosive international scale led by India. The strategic implication isn’t complicated — build for the 25–34 professional, create specifically for saves and private sharing, and stop using demographic data to narrow ad targeting when the AI systems perform better with broad inputs. The 2026 Strategic Outlook and Hootsuite’s demographic data both point to the same operational shift: demographics are now a creative brief input, not a targeting field. Teams that internalize this — using income, education, and behavioral data to write better creative rather than build tighter audience segments — will outperform those still fighting the algorithm with manual optimization tactics. The audience has never been more qualified or more accessible; the question is whether your content is meeting them where they are.


0 Comments