

Marketing budgets are increasingly shaped not by what performs best, but by what teams can actually defend in a boardroom. According to the 2026 Haus Decision Confidence Index, Google Search and YouTube command roughly 57% confidence scores each, while TikTok and Meta sit in the low-to-mid 40% range — and those confidence gaps are directly driving where dollars flow, regardless of incremental effectiveness. This tutorial walks you through how to audit your media mix by measurement confidence, build a defensible investment case for every channel, and operationalize the Brand as Performance (BaP) framework to stop leaving growth on the table.
What This Is: The Confidence-First Media Budget Phenomenon
The traditional model of media allocation was simple in theory: measure performance, fund what works, cut what doesn’t. In practice, 2026 has revealed a more complicated dynamic. Marketers are not funding the channels that generate the highest incremental return — they are funding the channels they can explain.
The Haus Decision Confidence Index, published in March 2026 by MarTech Senior Editor Constantine von Hoffman, defines measurement confidence as a marketer’s demonstrated ability to articulate and justify a channel’s direct impact on revenue generation. It is not a proxy for actual ROI. It is a proxy for communicability. And in most organizations, communicability wins budget wars.
This dynamic shows up clearly in the data. Google Search scores 57% on the confidence index. YouTube matches it at 57%. When both are counted as part of the combined Google advertising suite, the aggregate confidence score rises to 75%. Compare that to TikTok and Meta, both of which land in the low-to-mid 40% range, and you see the gap that shapes spend allocation.
What is driving those lower scores for Meta and TikTok? The article names three factors: attribution ambiguity, limited historical performance documentation within a given organization, and lower stakeholder buy-in at the executive level. Channels that are harder to plug into a spreadsheet and explain in a budget review get deprioritized — not because they don’t work, but because making the case for them requires more work than most marketing teams have bandwidth to do.
The result is a comfort zone effect. Budgets concentrate in channels where existing measurement infrastructure, multi-year performance history, and executive familiarity combine to lower the friction of defending the investment. Google Search has 30+ years of performance data, a near-universal tracking infrastructure, and conversion attribution that even a skeptical CFO can follow. TikTok does not. That asymmetry is worth more than incremental lift data when budget season arrives.
This is not a new human tendency — organizations have always funded what they can justify. What is new is the research report’s finding that 85% of CMOs agree brand investment drives results, yet budget allocation systematically favors performance marketing’s “quick wins” because they are easier to defend in quarterly reviews. The gap between what CMOs believe and what they fund is the confidence gap made structural.
The downstream consequence is that high-potential emerging channels — connected TV, influencer partnerships, brand activations — receive “significantly lower” confidence scores according to the Haus index, and therefore remain chronically underfunded relative to their potential reach and impact. The measurement infrastructure around these channels exists; it is just not as embedded in organizational workflows as search attribution.
Understanding this dynamic is the first step toward fixing it. Once you recognize that your media mix is being shaped by measurement confidence rather than raw performance, you can take deliberate steps to either raise the confidence floor on emerging channels or reallocate based on honest, evidence-backed performance data rather than institutional comfort.
Why It Matters: The Strategic Cost of Confidence Bias
If marketing teams are consistently over-investing in channels they can easily defend and under-investing in channels they cannot, the compounding opportunity cost is substantial. The research report documents this with hard data from the Brand as Performance (BaP) framework, which directly connects brand investment to measurable business outcomes.
Who is affected: Every organization running a multi-channel media mix. The confidence gap is not a startup problem or an enterprise problem — it is a structural feature of how budget decisions get made when marketing reports to finance. Agencies are also affected: clients will consistently resist investment in channels the agency cannot quantify in a single-session attribution window.
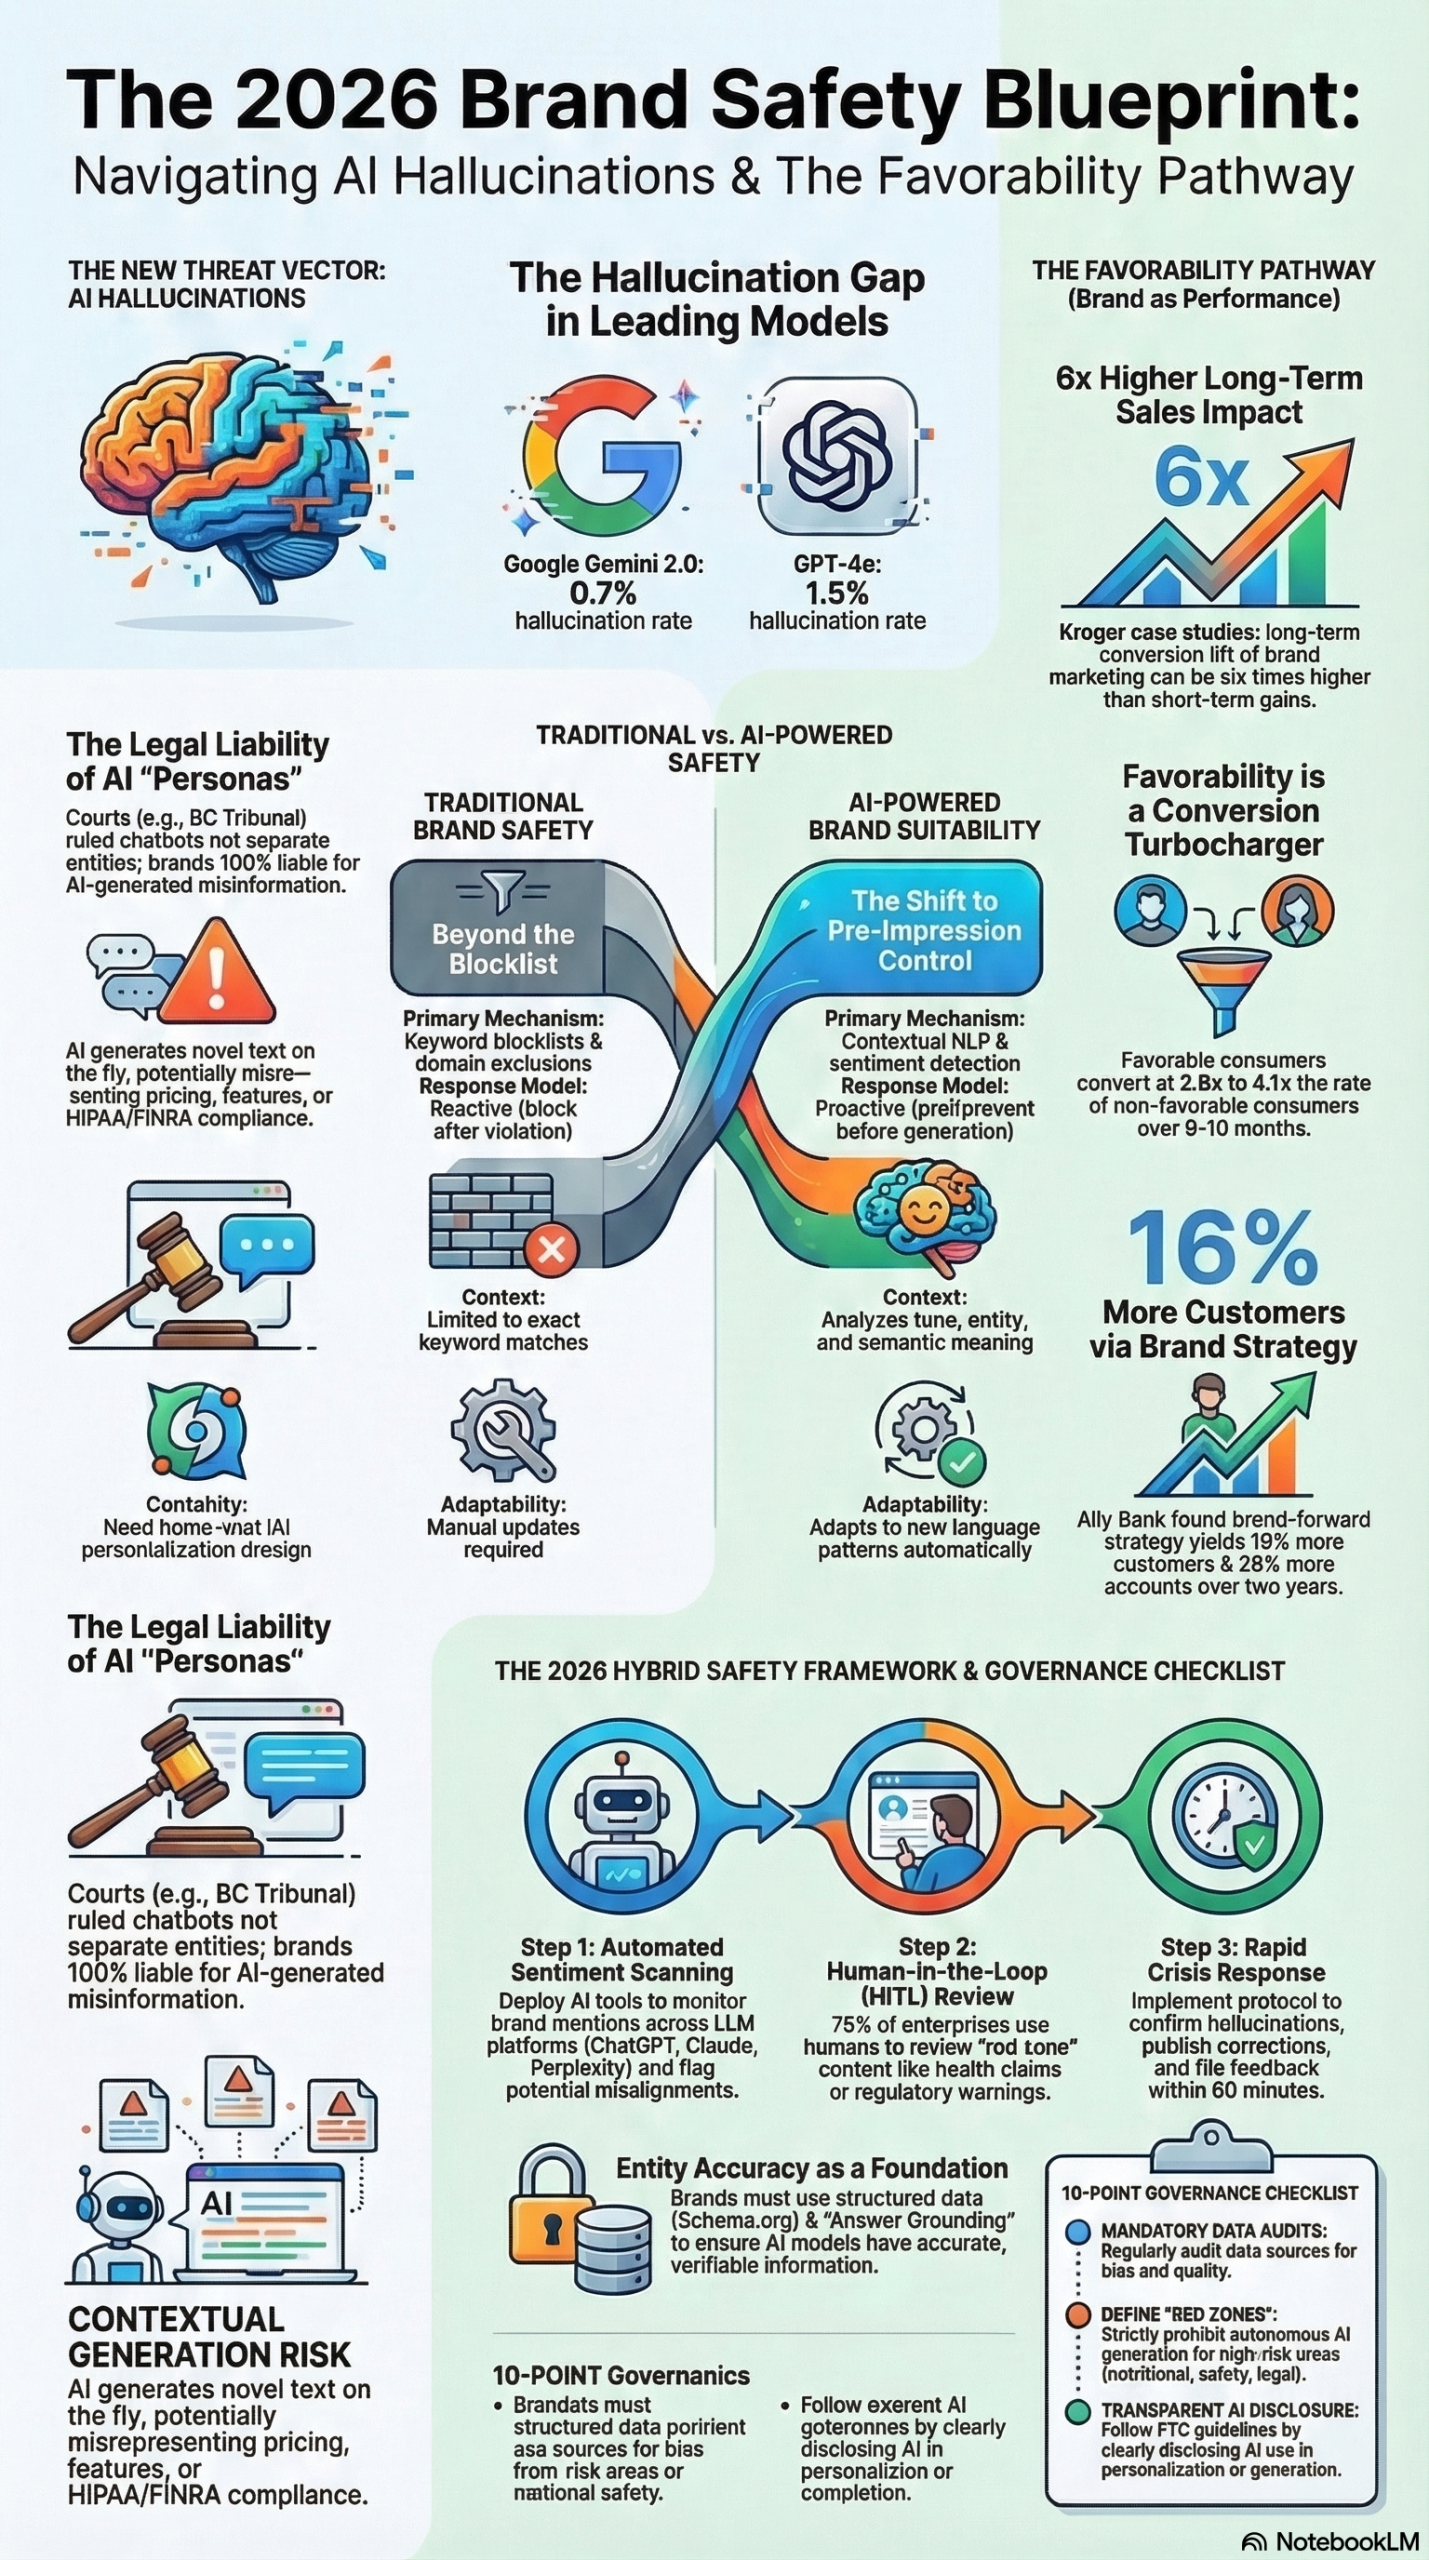
What changes: The BaP methodology, as documented in the research report, demonstrates that favorable brand perception is a quantifiable driver of conversion. Campbell’s found that consumers favorable to the brand purchase at 2.9x the rate of non-favorable consumers. Ally Bank projected that a brand-forward media strategy would generate 16% more customers and 29% more accounts over two years compared to a short-term performance-only strategy. Kroger’s “Krojis” campaign analysis found that 70% of the long-term campaign impact was attributable to consumers who held favorable brand opinions.
These numbers do not materialize inside a last-click attribution model. They only surface when you measure sentiment-to-sales linkage at the household level — which requires building measurement infrastructure, not just running Google ads and watching conversions tick up.
What makes this different from existing thinking: Previous frameworks framed brand vs. performance as a strategic choice. The confidence-first model reveals it as a measurement problem. You are not choosing between brand and performance; you are choosing between channels you currently know how to measure and channels you don’t. That reframe changes the solution entirely. The answer is not to abandon brand channels — it is to close the measurement confidence gap.
For practitioners specifically: If you manage media budgets and report to a CFO or CEO who demands ROI justification for every dollar, your ability to raise confidence scores on underinvested channels is a direct lever on your total addressable budget.
The Data: Channel Confidence vs. Expected Investment Growth
The following table synthesizes the 2026 Haus Decision Confidence Index with expected budget trajectory data, giving you a snapshot of where organizational money and organizational trust are currently aligned — and where they diverge.
| Channel | Measurement Confidence Score | Expected 2026 Budget Increase | Confidence-Spend Alignment |
|---|---|---|---|
| Google Search | 57% | ~80% of respondents | High alignment |
| YouTube | 57% | 72% of respondents | High alignment |
| Combined Google Suite | 75% | ~80% of respondents | High alignment |
| Meta (Facebook/Instagram) | Low-to-mid 40s | 71% of respondents | Moderate misalignment |
| TikTok | Low-to-mid 40s | Not reported as top growth channel | High misalignment |
| Connected TV | Significantly lower | Not a top growth channel | High misalignment |
| Influencer Partnerships | Significantly lower | Not a top growth channel | High misalignment |
| Brand Activations | Significantly lower | Not a top growth channel | High misalignment |
Source: 2026 Haus Decision Confidence Index via MarTech and AI Advertising and Brand Integrity: Strategic Briefing 2026
The Meta row is the most instructive. Despite a confidence score in the low-to-mid 40s, 71% of respondents expect to increase Meta investment. Meta’s scale, reach data, and embedded measurement tools — the Meta Pixel, Conversions API, Advantage+ attribution — create enough perceived defensibility to override the lower raw confidence score. This shows that confidence is not just about the channel’s actual measurability; it is also about the tooling an organization has already built around that channel.
Step-by-Step Tutorial: Building a Confidence-Adjusted Media Strategy
This is a practical framework for auditing your current media mix, scoring channels by measurement confidence, closing confidence gaps, and reallocating spend based on evidence rather than institutional comfort.
Prerequisites
- Access to your current media mix data (channel spend by month, at minimum 12 months)
- Conversion and attribution data from each channel
- A CRM or data warehouse where audience segments can be matched across touchpoints
- At least one executive sponsor willing to engage with new measurement methodologies
Phase 1: Audit Your Current Confidence Distribution
Step 1: List every active channel in your media mix.
Pull your full channel roster — paid search, paid social, programmatic display, YouTube, CTV, influencer, email, affiliate, brand activation, out-of-home. Include every line item, even the small ones.
Step 2: Score each channel on four confidence dimensions.
For each channel, rate it 1–5 on the following axes:
- Attribution clarity: Can you track conversions from this channel to a sale in your current stack? (1 = black box, 5 = full deterministic attribution)
- Historical depth: How many years of in-house performance data do you have? (1 = less than 6 months, 5 = 3+ years)
- Stakeholder fluency: How well do your CFO and CEO understand this channel’s role? (1 = they’ve never seen a report on it, 5 = they can explain it themselves)
- Tool integration: Does this channel have native measurement tooling already integrated into your reporting stack? (1 = manual exports, 5 = live dashboard integration)
Step 3: Calculate a composite confidence score per channel.
Average the four dimension scores and multiply by 20 to get a 0–100 scale. A channel scoring 3/3/3/3 = average 3.0 × 20 = 60 confidence score.
Step 4: Plot confidence score against current spend share.
Map each channel on a 2×2 grid: X-axis is confidence score (0–100), Y-axis is current spend share (0–100%). Channels in the high-confidence, high-spend quadrant are your anchor channels. Channels in the low-confidence, high-spend quadrant are where confidence bias is most expensive.
Phase 2: Identify the Measurement Gaps on Underinvested Channels
Step 5: Pick two or three channels in the low-confidence zone that you believe have strategic potential.
Based on audience data, competitive intelligence, or category trends, identify channels where you suspect performance is real but cannot currently prove it. These are your measurement gap targets.
Step 6: Define what “defensible” looks like for each target channel.
For each channel, answer: “What single metric, if I could measure it reliably, would make this channel defensible in a budget review?” For CTV, that might be brand lift. For influencer, it might be attributed first-time purchasers. For brand activation, it might be incremental search volume lift. Write this down explicitly — it becomes your measurement objective.
Step 7: Build or acquire the measurement infrastructure.
Depending on the channel, this could mean:
– Deploying geo-based incrementality tests (run the channel in 50% of markets, hold the other 50% as control, measure differential conversion rates)
– Implementing brand lift studies through platform-native tools (YouTube Brand Lift, Meta Brand Polls) or third-party measurement vendors
– Building a multi-touch attribution model in your data warehouse that assigns fractional credit across touchpoints using time-decay or data-driven weighting
– Adopting the BaP framework (research report) by linking your CRM sentiment data to purchase behavior at the household level
This infrastructure investment is a prerequisite for raising the confidence floor on emerging channels. The research report documents that AI tools can be a “force multiplier” here — increasing output of analytics operations by 40–60% when integrated into data workflows — but the data foundation must exist first.
Phase 3: Run Structured Confidence-Building Experiments
Step 8: Allocate a defined test budget to each measurement gap channel.
The rule of thumb: allocate enough to achieve statistical significance in your incrementality test, but not so much that the test result materially impacts business outcomes. For most mid-market brands, this is 5–10% of the total channel budget for a 60–90 day test window.
Step 9: Define success criteria before the test starts.
What incremental ROAS, brand lift percentage, or new customer acquisition rate would justify increasing this channel’s confidence score by at least 15 points? Set that threshold before you look at any data. This prevents post-hoc rationalization of inconclusive results.
Step 10: Run the test with clean data hygiene.
The research report explicitly flags “dirty data” as a primary cause of campaign drift, where campaigns gradually stray from intended audiences due to subtle data errors. Before launching your test:
– Consolidate your data into a single system of record for multichannel campaigns
– Standardize naming conventions across CRM and ad platforms for audience segmentation
– Automate data cleaning to reduce manual entry errors
Step 11: Document and present results in the executive language of your organization.
When the test concludes, present results not as marketing metrics but as business outcomes. Use the BaP model structure: favorable customer acquisition → conversion rate differential → projected revenue impact. The research report cites Ally Bank’s use of this framing (16% more customers, 29% more accounts) as an example of translating brand investment into board-level language.
Phase 4: Reallocate Spend Based on Evidence, Not Comfort
Step 12: Update your channel confidence scores with test results.
Repeat the scoring exercise from Phase 1 with updated data. Channels where your test generated clear, statistically significant positive results should see their attribution clarity and historical depth scores increase. Calculate new composite confidence scores.
Step 13: Build a rolling reallocation model.
Rather than a single annual budget reallocation, build a quarterly review process:
– Q1: Audit confidence scores, identify top two measurement gap opportunities
– Q2: Run incrementality tests on target channels
– Q3: Analyze results, update confidence scores
– Q4: Rebalance spend for the following year based on evidence-updated confidence scores
Step 14: Protect anchor channels with documented efficiency floors.
Before reallocating away from high-confidence channels, document the efficiency floor — the minimum spend level at which those channels continue to generate acceptable returns. The research report notes that 54% of CMOs prioritize performance marketing, and anchor channels like Google Search are genuinely high-performing. The goal is not to defund them but to prevent confidence bias from over-concentrating spend beyond the efficiency floor.
Expected Outcomes: Teams that complete this cycle typically find two to three channels where they have been systematically under-investing due to measurement gaps rather than actual performance deficits. Closing those gaps and adjusting spend accordingly — guided by BaP-style household-level linkage — is the operational path to the outcomes documented in the research: Campbell’s 2.9x conversion rate differential, Kroger’s 70% long-term impact concentration in favorable-brand consumers.
Real-World Use Cases
Use Case 1: Mid-Market DTC Brand Recovering from Performance Marketing Over-Concentration
Scenario: A direct-to-consumer apparel brand with $8M annual media spend has allocated 85% to Google Search and Meta over three years. ROAS has been declining 12% YoY as auction costs rise, but the team keeps optimizing within the same channels because they are the only ones leadership understands.
Implementation: Run a Phase 1 confidence audit. Score CTV and podcast advertising — both sitting at low confidence due to zero in-house measurement history. Allocate $400K (5% of budget) to a 90-day CTV incrementality test using geo-holdout methodology. Measure new-to-brand purchasers and site search volume lift in test markets vs. control.
Expected Outcome: If CTV shows a 1.5–2x incremental ROAS versus the holdout, the brand can update CTV’s confidence score, present the geo-test data to leadership, and justify a 10–15% reallocation from Google Search into CTV — reducing auction exposure while maintaining overall conversion volume.
Use Case 2: B2B SaaS Company Applying BaP to Justify Brand Campaign Investment
Scenario: A B2B SaaS company’s CMO wants to run a brand awareness campaign targeting mid-market CIOs, but the CFO demands attribution to pipeline. The CMO has been arguing brand investment qualitatively for two years without success.
Implementation: Apply the BaP framework from the research report. Use CRM data to segment prospects into favorable, neutral, and unfavorable based on content engagement signals (webinar attendance, whitepaper downloads, repeat site visits). Track conversion rates from MQL to SQL to closed-won across each segment. If the data mirrors the Campbell’s finding (favorable-brand consumers purchasing at 2.9x the rate of non-favorable), the CMO now has a quantified business case.
Expected Outcome: A measurable conversion rate differential between favorable and unfavorable prospects creates a defensible ROI model for brand investment. The confidence score for brand campaigns rises from anecdote to data, and pipeline attribution — even if indirect — becomes available.
Use Case 3: Media Agency Building Confidence-Scoring Into Client Reporting
Scenario: A mid-size performance marketing agency manages media for 15 clients, all of whom ask the same question every quarter: “Are we spending in the right places?” The agency’s current answer is ROAS by channel — but that answer systematically favors Google Search and ignores confidence gaps.
Implementation: Build a standardized four-dimension confidence scorecard (attribution clarity, historical depth, stakeholder fluency, tool integration) into quarterly business review templates. For each client, plot current spend vs. confidence score to identify misalignment. Recommend channel-specific measurement infrastructure upgrades — brand lift studies, incrementality tests, CRM-to-purchase linkage — as billable services.
Expected Outcome: Clients receive a more complete picture of their media mix health. The agency differentiates on measurement sophistication rather than channel access. Confidence-building services become a revenue stream that also produces better client outcomes.
Use Case 4: Enterprise Retailer Using AI-Assisted Measurement Consolidation
Scenario: A large omnichannel retailer has measurement data spread across six different platforms — Google Analytics, a CDP, an MMM vendor, a brand lift study platform, a CRM, and a custom data warehouse. The data quality is inconsistent, and campaign drift (research report) is causing audience segments to gradually diverge from intent.
Implementation: Consolidate all measurement data into a single system of record. Implement automated naming convention standardization across CRM and ad platforms. Use AI-assisted data cleaning tools to replace manual triage with automated error detection and correction. The research report documents that AI integration into analytical workflows increases output by 40–60%; applied to data operations, this means fewer strategist hours spent on manual data entry and more on strategic analysis.
Expected Outcome: Cleaner data means incrementality test results become more reliable, confidence scores for emerging channels can be credibly updated, and the quarterly reallocation model produces decisions based on actual performance rather than measurement artifacts.
Common Pitfalls
Pitfall 1: Treating measurement confidence as a proxy for actual performance.
Confidence and performance are correlated but not identical. A high confidence score on Google Search means you can easily measure it — not that it is generating the best incremental return. The entire point of this framework is to distinguish between the two. If you use confidence scores to validate current spend rather than to identify measurement gaps, you replicate the bias you were trying to fix.
Pitfall 2: Running underpowered incrementality tests.
A geo-holdout test needs sufficient geographic reach, test duration, and budget to achieve statistical significance. Teams frequently run tests at 1–2% of channel budget for 14 days and then declare a channel “unproven” when the test was simply too small to detect a real effect. Size your tests properly before you start, and define significance thresholds in advance.
Pitfall 3: Conflating dirty data with low channel performance.
The research report explicitly calls out campaign drift — where campaigns gradually stray from intended audiences due to data errors — as a major source of apparent underperformance on emerging channels. Before concluding that a channel does not work, audit the data quality behind the measurement. Siloed data, inconsistent naming conventions, and manual entry errors all produce false negatives that suppress confidence scores artificially.
Pitfall 4: Skipping the executive stakeholder step.
Measurement infrastructure alone does not change budget decisions. You must also build stakeholder fluency in the new channels you want to fund. If your CFO has never seen a geo-holdout study before, a 20-page technical report will not move the needle. Translate results into business outcomes — customers, revenue, margin — and present them in the format your executive team already uses for other capital allocation decisions.
Pitfall 5: Over-rotating away from anchor channels before confidence gaps are closed.
Cutting Google Search before you have validated CTV or TikTok is a sequence error. Raise the confidence floor on emerging channels first, confirm performance, then gradually reallocate. The goal is evidence-based diversification, not diversification for its own sake.
Expert Tips
Tip 1: Use Gartner’s framework to frame brand investment for CFOs.
As Alex De Fursac Gash, VP Analyst at Gartner, states in the research report: “Brand awareness is the commercial spark that can drive greater consideration and conversion.” This framing — brand as an enabler of performance, not a competitor to it — is the right language for executive conversations. Stop arguing brand vs. performance and start presenting brand as the demand-generation layer that makes performance marketing more efficient.
Tip 2: Build incrementality testing into your annual planning calendar, not just your experimental roadmap.
Incrementality tests should be standing line items in your media plan, not one-off experiments. Schedule one geo-holdout test per quarter per emerging channel you want to eventually scale. Over two years, you accumulate enough replicated evidence to move a channel from “low-confidence experiment” to “evidence-backed investment.”
Tip 3: Invest in structured data on your own properties to reduce AI hallucination risk for brand-adjacent content.
The research report documents that AI systems hallucinate brand information, with GPT-4o at 1.5% and Google Gemini 2.0 at 0.7% hallucination rates. Implement Organization, Product, and FAQ schema markup on your website to give AI-powered search and media tools authoritative, structured data about your brand to pull from. This directly reduces the risk of AI-generated misinformation about your products in paid or organic placements.
Tip 4: Apply the BaP framework at the audience segment level before presenting it to leadership.
Run the favorable/neutral/unfavorable segment analysis on your own CRM data before proposing a BaP investment strategy. If your data shows a conversion rate differential similar to Campbell’s 2.9x finding, you have an internally validated business case. If it doesn’t, you know your audience favorability scores need work before the downstream conversion benefit will materialize.
Tip 5: Designate a confidence score owner within your analytics or AdOps function.
Confidence scores decay. A channel that was well-measured two years ago may now have broken pixel tracking, deprecated API integrations, or attribution methodology changes that have lowered its actual confidence without anyone noticing. Assign explicit ownership of the confidence scorecard to a specific person, with a quarterly update cadence, to prevent measurement infrastructure from quietly deteriorating.
FAQ
Q1: Isn’t this just a fancy way of saying “invest in measurement”?
Partially, yes — but the confidence-first framework adds specificity that generic “invest in measurement” advice lacks. It forces you to identify which channels have confidence gaps, what kind of measurement infrastructure is missing, and what threshold of confidence would justify a budget shift. It also names the organizational dynamic explicitly: the reason you are not already investing in better measurement for TikTok or CTV is not a lack of awareness — it is that the payoff (higher confidence, potentially rebalanced spend) requires political work that is easier to skip than to do.
Q2: How much of the meta/TikTok “low confidence” score is measurement reality vs. organizational bias?
Both. Meta has genuinely complex attribution — last-click models undercount its impact on upper-funnel behavior, while view-through attribution over-credits it. Those are real measurement challenges. But the confidence gap is also organizational: teams that have three years of Meta data and trained staff understand how to read Meta results, while the same team looking at TikTok analytics for the first time will naturally feel less confident, even if the underlying data quality is similar.
Q3: What’s the minimum budget to run a credible incrementality test?
This depends on your base conversion volume and the size of the effect you are trying to detect. As a practical floor: if a channel is generating fewer than 200 attributable conversions per month at current scale, you will likely need a 90-day test to achieve statistical significance. For most mid-market brands, that means your test budget for a new channel should be at least $50K–$100K to generate enough signal. Below that threshold, you are more likely to generate an inconclusive result than a clear answer.
Q4: How does the BaP framework integrate with last-click attribution models already in place?
It does not replace last-click — it runs alongside it. BaP requires CRM-level data linking individual households or accounts to brand sentiment signals (content engagement, survey responses, social interaction) and then to purchase behavior. Your last-click model tells you which click drove the transaction; BaP tells you whether the person who clicked was already favorably disposed toward your brand, and how that disposition affects conversion rates across the funnel. The two models answer different questions and both are necessary for a complete picture.
Q5: What is “campaign drift” and how do I know if it is affecting my results?
Campaign drift, as documented in the research report, occurs when subtle data errors — inconsistent audience naming, stale CRM segments, broken pixel mapping — cause your campaigns to gradually reach an audience that diverges from your intended target. Symptoms include: ROAS declining without a clear change in bids or creative, audience demographic shifts visible in platform reporting that do not match your targeting settings, or CRM-to-ad platform audience match rates dropping below 60%. The fix is standardized naming conventions, automated data cleaning, and a single system of record for multichannel campaign data, as outlined in Phase 3 of the tutorial above.
Bottom Line
The 2026 Haus Decision Confidence Index makes a structural problem visible: marketing budgets are shaped by the ability to defend a channel, not just by evidence of its effectiveness. Google Search at 57% confidence and ~80% of respondents expecting increased investment tells you that high-confidence channels will continue to attract disproportionate spend, while TikTok and CTV remain underfunded relative to their potential reach simply because the measurement infrastructure does not exist yet. The practitioner move is not to argue philosophically about brand vs. performance — it is to close the confidence gap on the channels you believe in, using incrementality tests, BaP-style household linkage, and clean data infrastructure. As the research report documents with cases from Campbell’s, Ally Bank, and Kroger, the brands already doing this are generating compounding advantages: favorable consumers converting at 2.9–4.1x the rate of non-favorable consumers, and brand-forward strategies projecting 16–29% more customer and account growth over two years. The confidence gap is a measurement problem, and measurement problems have solutions.


0 Comments