Tracking Brand Visibility Across AI Engines with the Moz AI Visibility Dashboard
The rise of AI-generated answers has created a blind spot in traditional SEO reporting: your brand might rank on Google but go unmentioned by ChatGPT, Gemini, or Perplexity. The Moz AI Visibility Dashboard closes that gap, giving you a prompt-level view of where and how often your brand appears in large language model responses. By the end of this walkthrough, you’ll know how to read every section of the dashboard — from the top-line performance summary to the competitive trend charts — and understand what actions the data points toward.
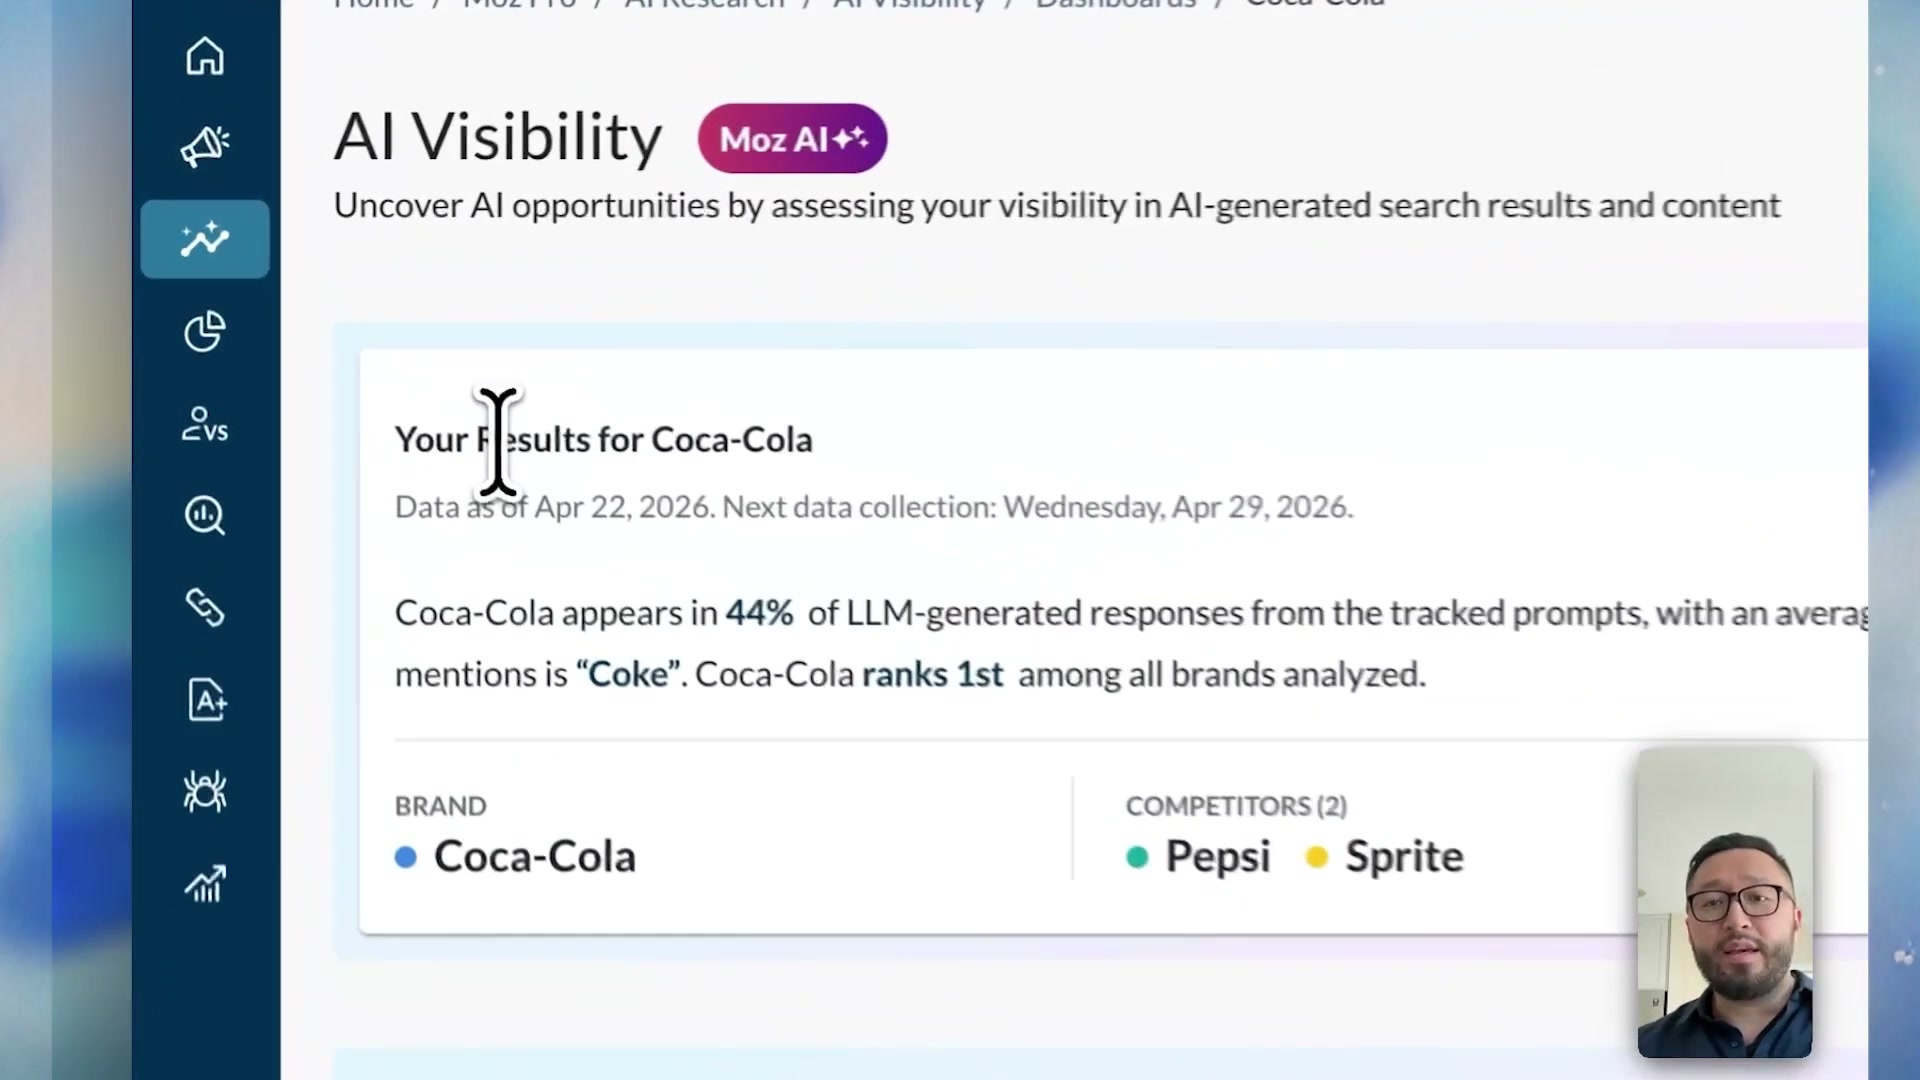
- After the dashboard finishes its initial load, the first thing you see is the Performance Summary. This panel surfaces three headline numbers: the percentage of tracked prompts in which your brand appeared, your average brand position, and a direct comparison against the competitors you set up during onboarding. For the Coca-Cola example shown in the video, the brand appears in 44% of LLM responses and holds the first-place rank among its tracked set.
-
The dashboard defaults to showing data for all AI engines combined. To isolate a specific engine, click the AI engine dropdown at the top of the interface and select the one you want — Gemini, ChatGPT, Perplexity, and others are available depending on your plan. Every metric on the page recalculates for that engine alone once you make a selection.
-
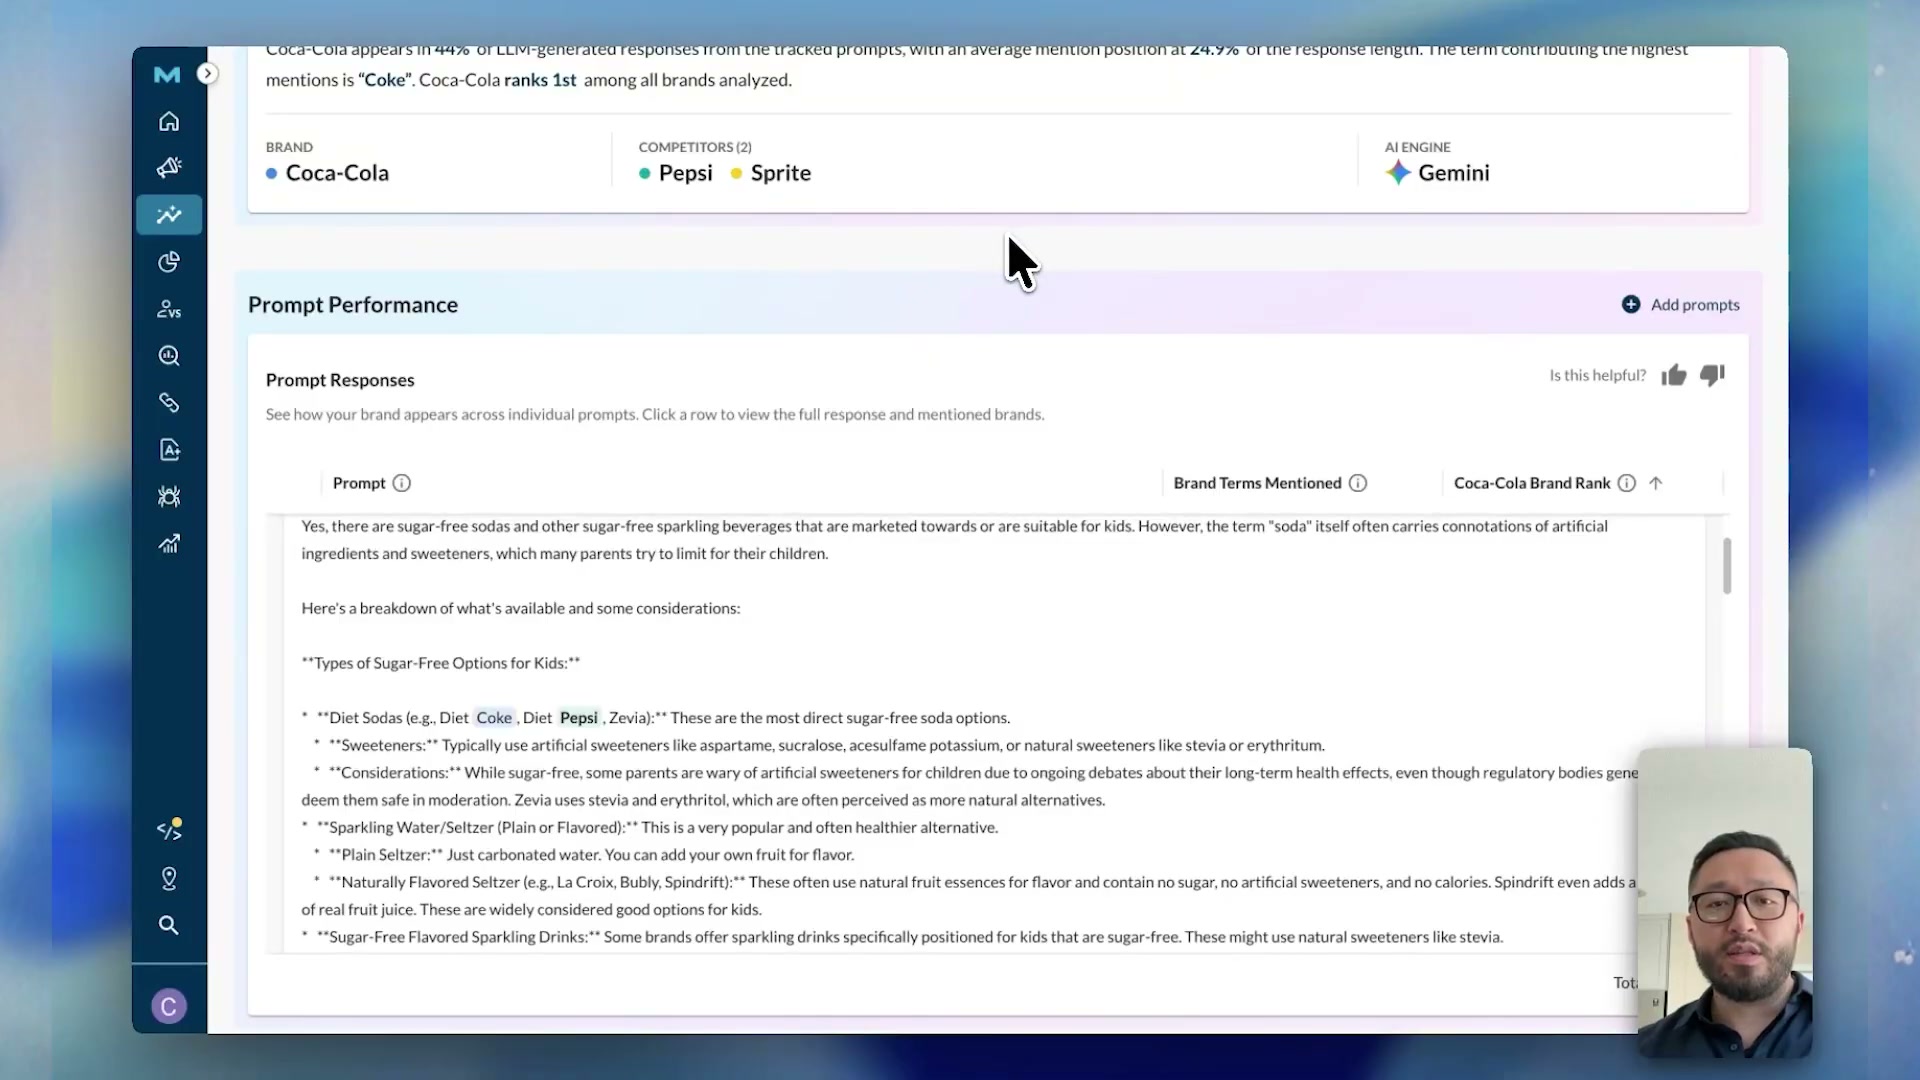
With your engine selected, scroll down to the Prompt Performance table. This section lists every tracked prompt in your configuration alongside color-coded brand indicators — one dot per competitor, colored by brand — and a rank column showing where your brand appeared within that response.

-
Scan the table to identify which prompts your brand is winning and which it’s missing. In the example, the prompt “are there sugar-free sodas for kids?” shows Coca-Cola mentioned first, Pepsi second, and Sprite absent entirely — a clear signal about which topic category is driving visibility.
-
To read the underlying AI-generated text, click the expand dropdown on any prompt row. The full LLM response appears inline, with brand mentions highlighted so you can see the exact phrasing and context the engine used.
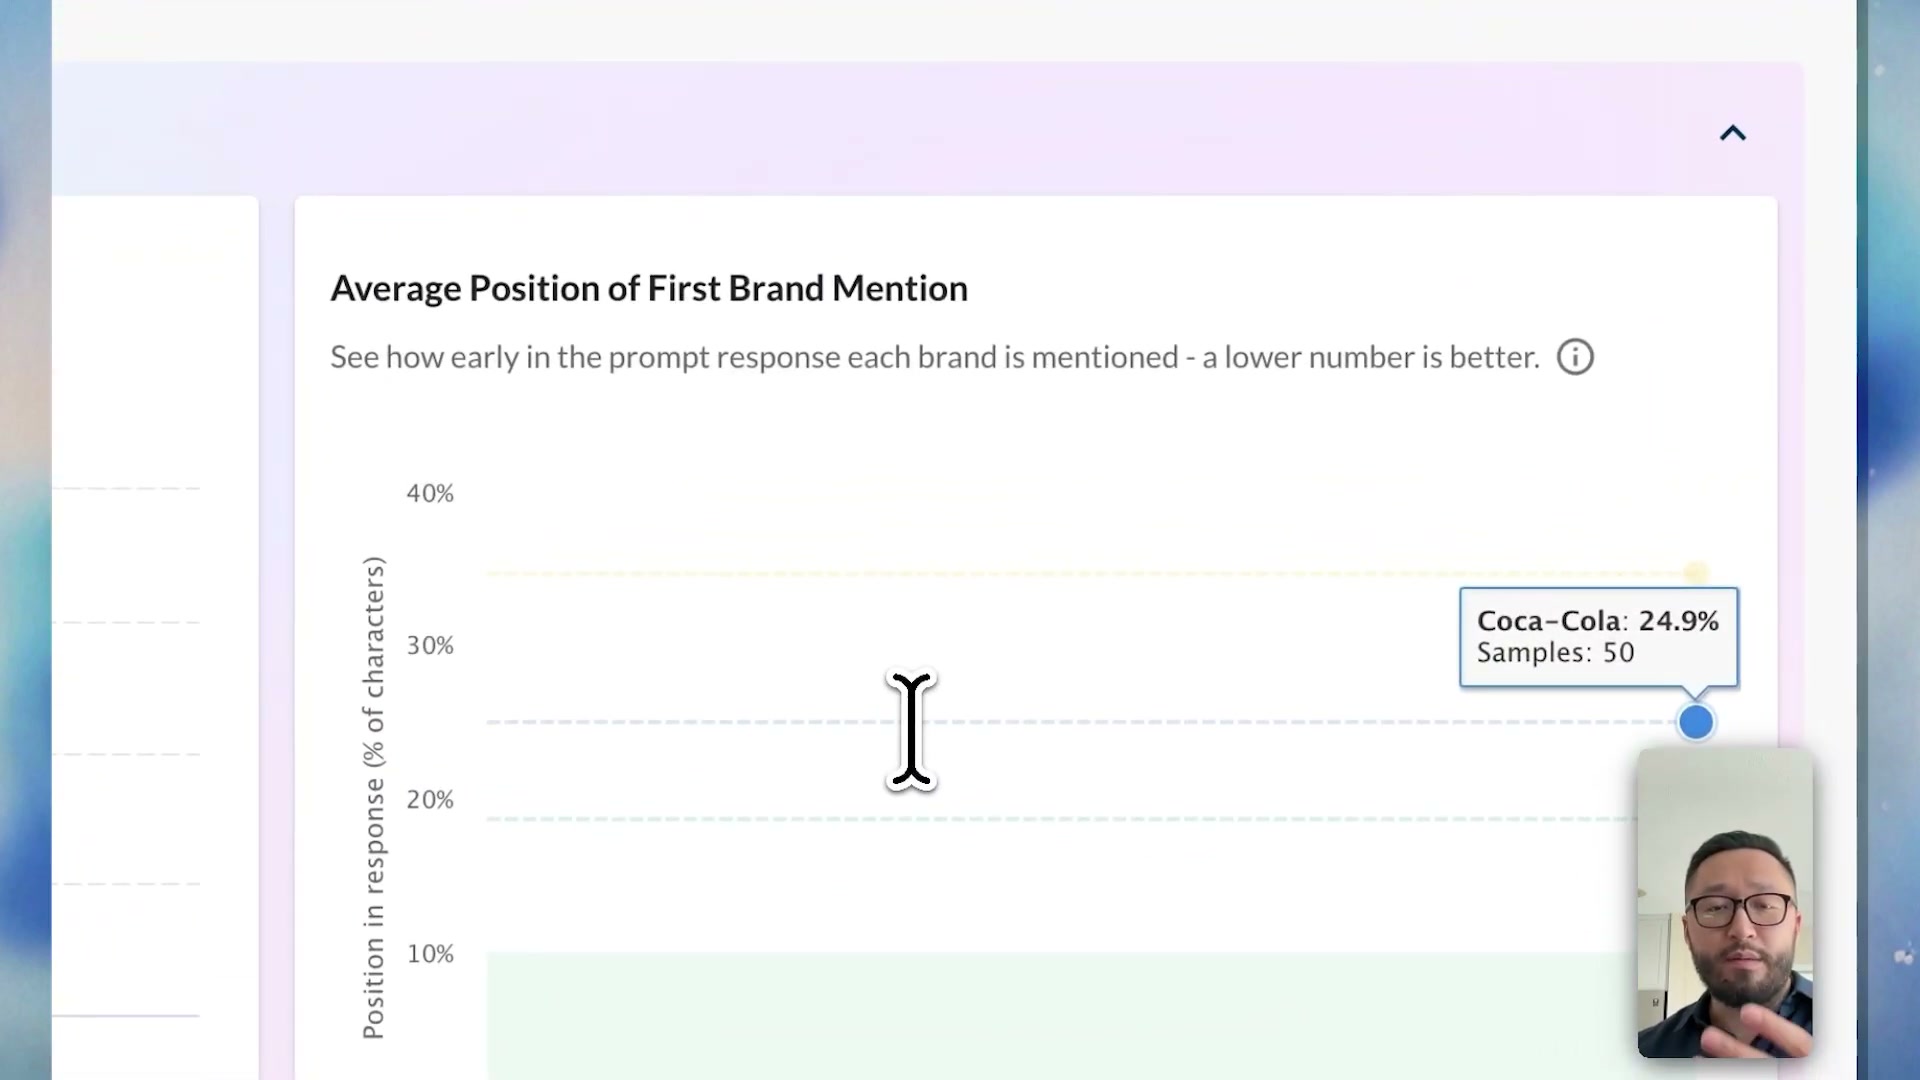
- Below the Prompt Performance table, the Mentions and Positioning section gives you two aggregate metrics: share of mentions (the percentage of all prompts where your brand appeared) and average mention position (how far into a response your brand first appears, expressed as a percentage of total response length). A lower position percentage is better — it means your brand surfaces earlier in the answer.
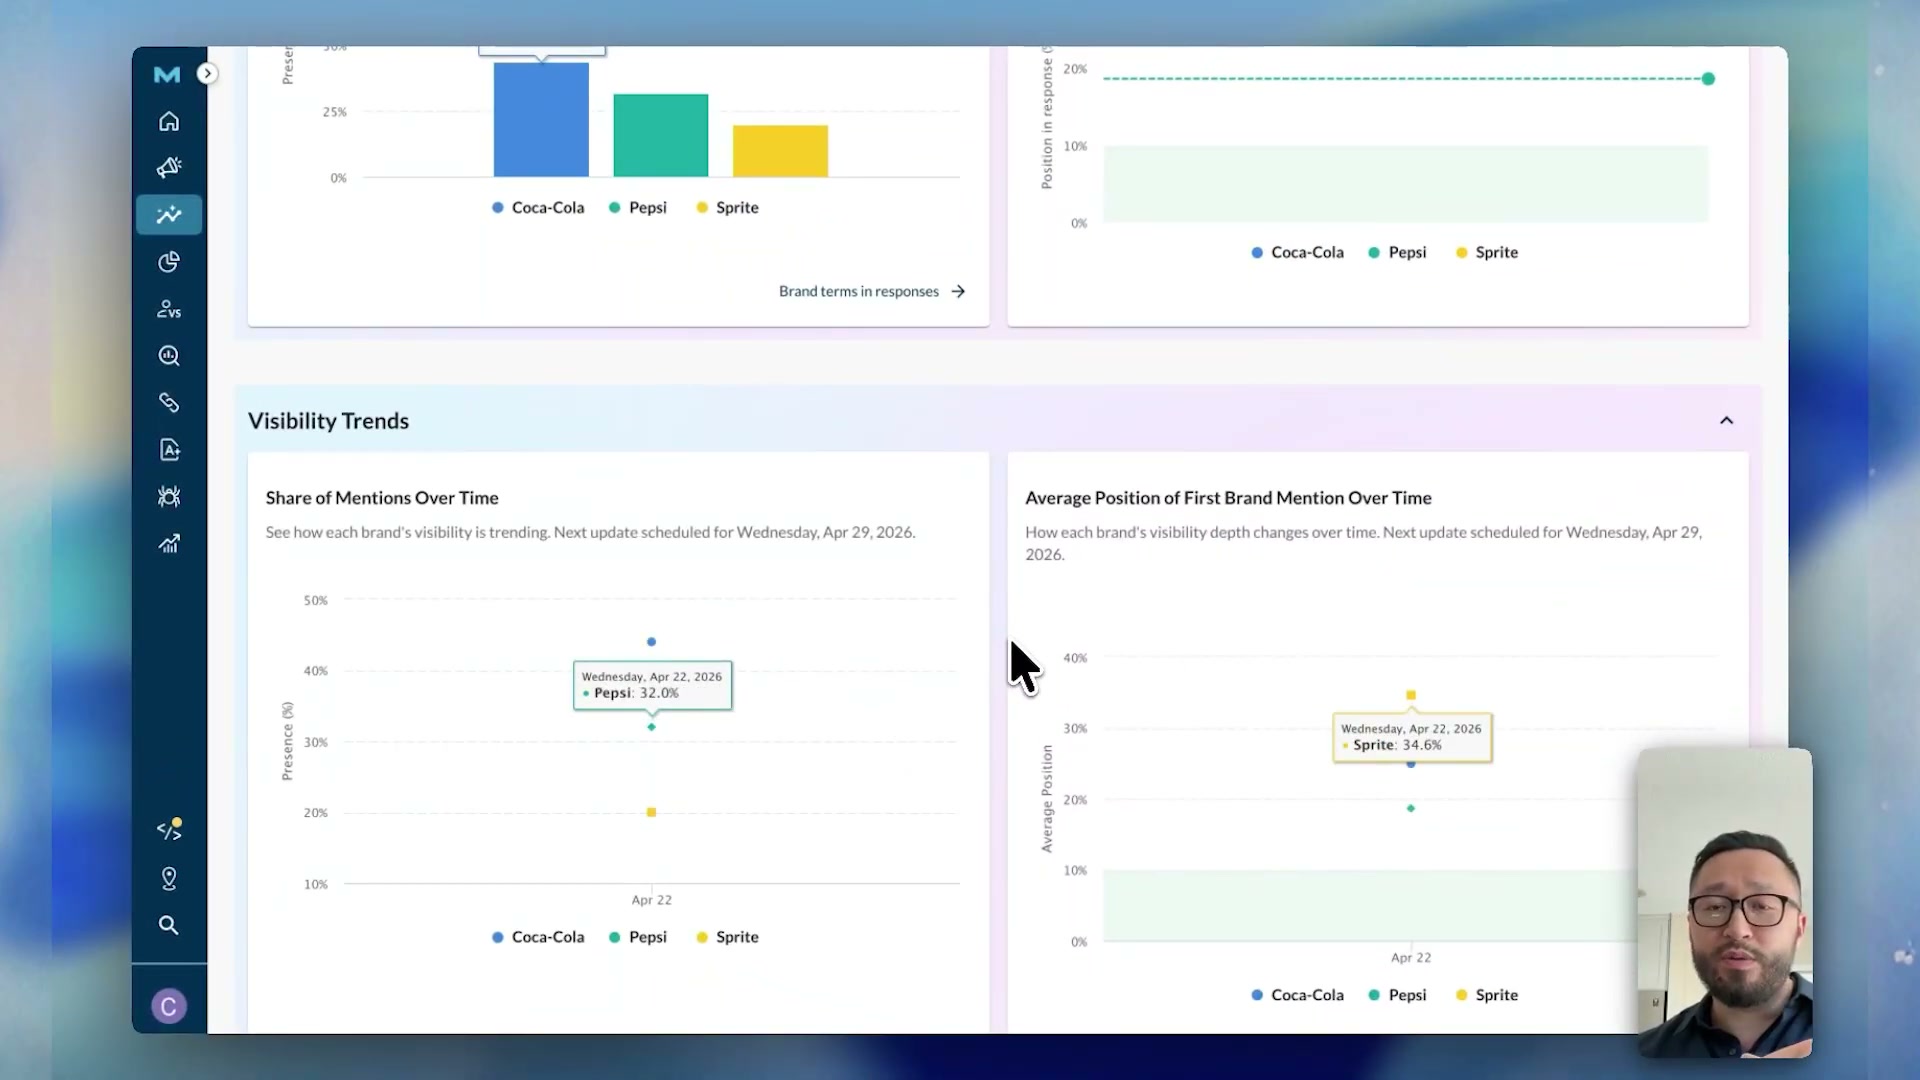
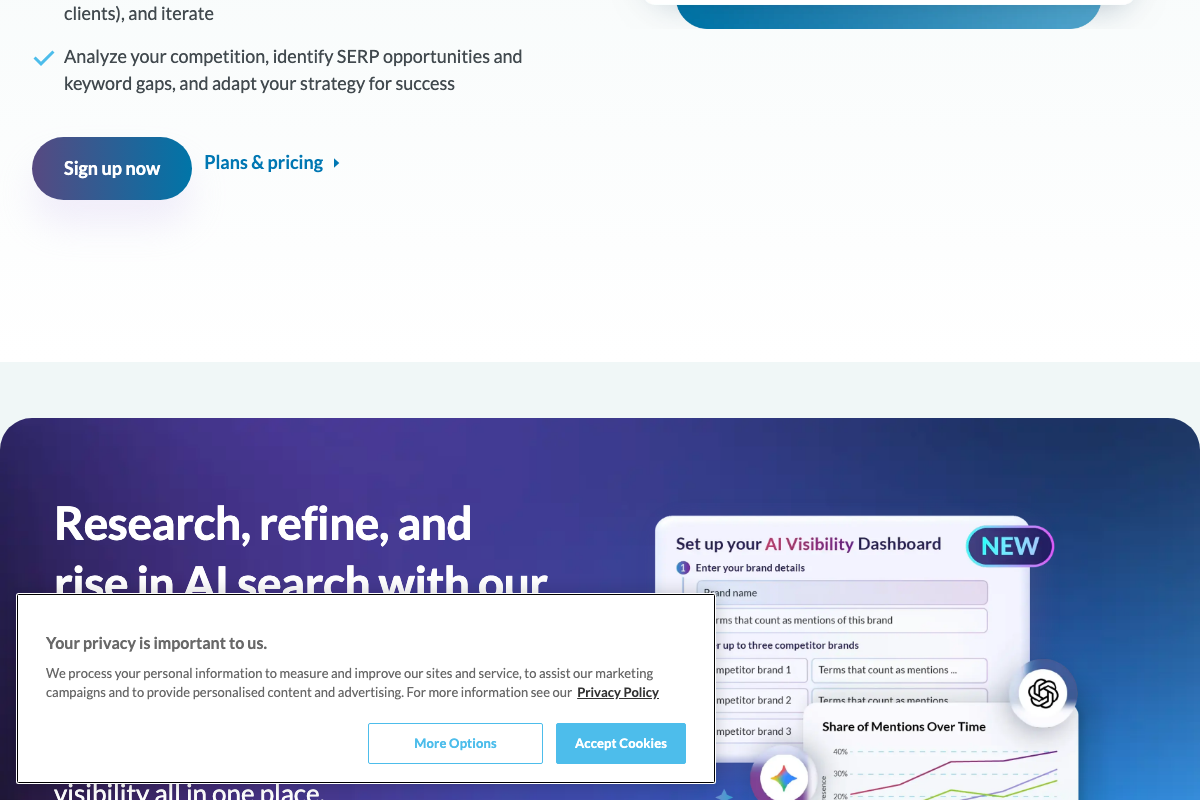
- At the bottom of the dashboard, the Visibility Trend section displays two time-series charts side by side: Share of Mentions Over Time and Average Position of First Brand Mention Over Time. A newly created dashboard will show a single data point here; as Moz collects additional snapshots, both charts fill in and allow you to track momentum shifts against competitors.
How does this compare to the official docs?
The dashboard tour in the video is a strong orientation, but Moz’s own documentation and help resources define precise methodology details — sampling frequency, how position is calculated, and which engines are included at each tier — that the walkthrough leaves open.
Here’s What the Official Docs Show
The video gives you a solid walkthrough of the Moz AI Visibility Dashboard’s core workflow — this section adds what Moz’s published marketing materials and the Gemini API documentation reveal about configuration requirements and engine specifics the tutorial moves past quickly. Nothing here overrides the video’s approach; it fills in the gaps before they cost you setup time.
Step 1: Finding the AI Visibility Dashboard in Moz Pro
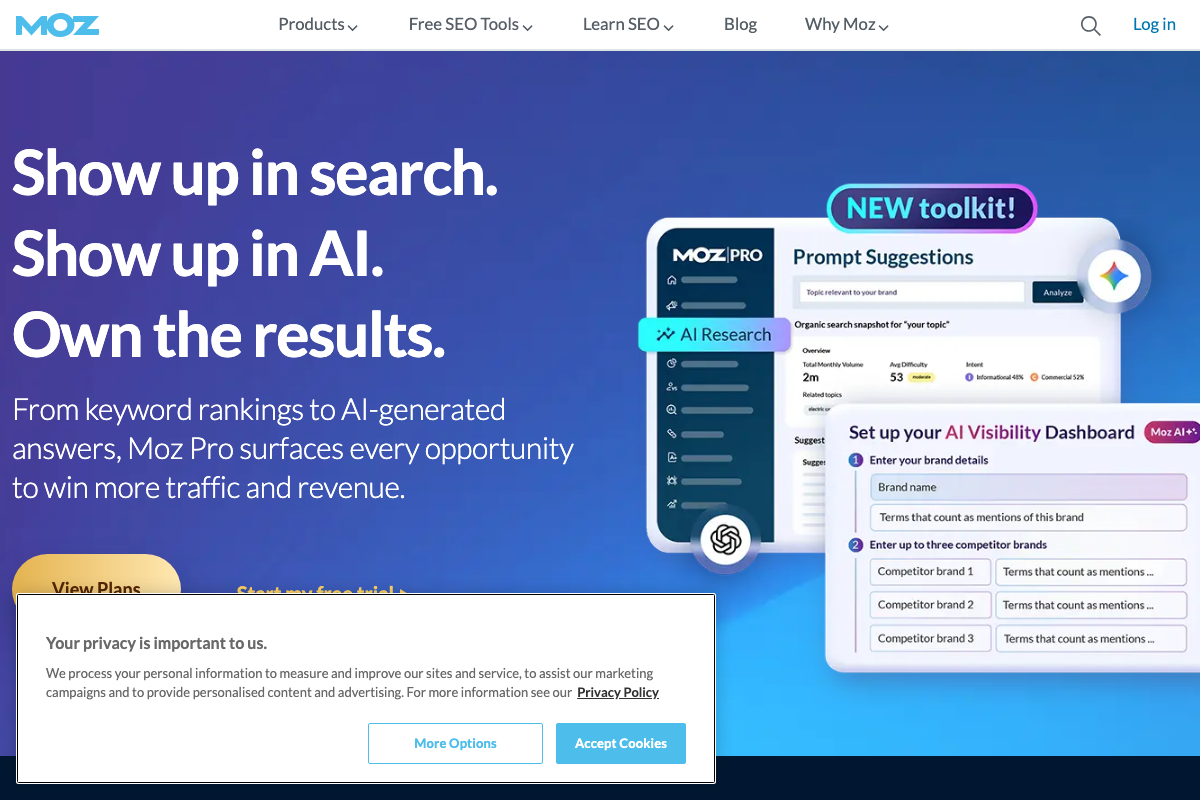
The video’s approach here matches the current docs exactly. Moz’s materials confirm the AI Visibility Dashboard is a dedicated top-level module within Moz Pro, accessible via its own “AI Visibility” navigation tab — a standalone section separate from SEO, Digital PR, and Local Marketing.
Step 2: Reading the Performance Summary
No official documentation was found for this step — proceed using the video’s approach and verify independently.
One setup detail the docs do surface before you reach the summary panel: the configuration form includes a required “Terms that count as mentions of this brand” field for every tracked entity — your own brand and each competitor. The tutorial doesn’t mention this field, but you’ll need to complete it during onboarding for all tracked brands before the dashboard populates.
Step 3: Filtering by AI Engine
No official documentation was found for this step — proceed using the video’s approach and verify independently.
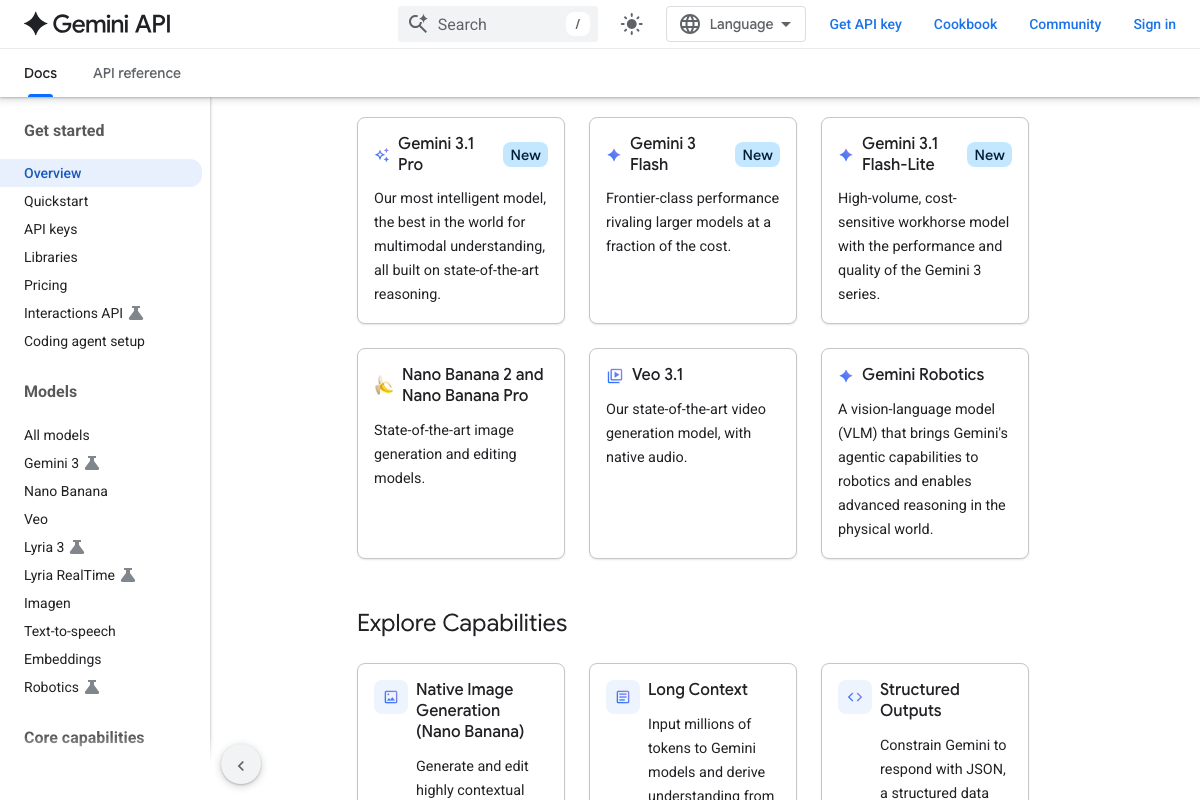
Worth noting for context: as of April 2026, “Gemini” is not a single model. Google’s current lineup includes Gemini 3.1 Pro, Gemini 3 Flash, and Gemini 3.1 Flash-Lite — all labeled “New” in the API catalog. Which specific version Moz queries under its “Gemini” filter is not documented in any publicly available resource. Additionally, Gemini responses can be grounded in live Google Search results rather than static model knowledge, meaning brand mention patterns for Gemini may shift more frequently than for engines without real-time retrieval.
Step 4: Scanning the Prompt Performance Table for Wins and Gaps
No official documentation was found for this step — proceed using the video’s approach and verify independently.
Step 5: Expanding a Prompt Row to Read the Full LLM Response
No official documentation was found for this step — proceed using the video’s approach and verify independently.
Step 6: Interpreting Mentions and Positioning Metrics
No official documentation was found for this step — proceed using the video’s approach and verify independently.
Step 7: Reading the Visibility Trend Charts
The video’s approach here matches the current docs exactly. Moz’s own marketing materials show the “Share of Mentions Over Time” chart as a multi-brand percentage trend with overlapping lines — consistent with the competitive time-series view described for both the share of mentions and average position charts at the bottom of the dashboard.
Useful Links
- Moz — SEO Software for Smarter Marketing — Source of all three AI Visibility Dashboard screenshots, including the setup configuration form and the Share of Mentions trend chart mockup.
- Gemini API | Google AI for Developers — Google’s official Gemini API documentation confirming current model versions, real-time search grounding capabilities, and the active Python quickstart reference.


0 Comments