The Digital Marketing Metrics That Actually Matter in 2026
Most marketing teams are drowning in dashboards while staying confused about what’s actually driving leads, revenue, and growth. This walkthrough — demonstrated live inside Google Analytics 4 and Semrush — cuts through that noise. By the end, you’ll know exactly which metrics to track for lead generation and e-commerce businesses, how to segment them meaningfully, and where to find the gaps your competitors are ignoring.
-
Identify the single most important on-site conversion event for your business model. For lead generation, that’s typically a form submission, quote request, or phone call. For e-commerce, it’s purchase. Everything else you track should ladder up to this primary event.
-
In GA4, configure key events to capture that primary conversion alongside supporting micro-conversions — such as first-time call clicks and repeat calls. Repeat calls are worth separating because they often signal existing customers, not new leads, and will skew your channel attribution if lumped together.
-
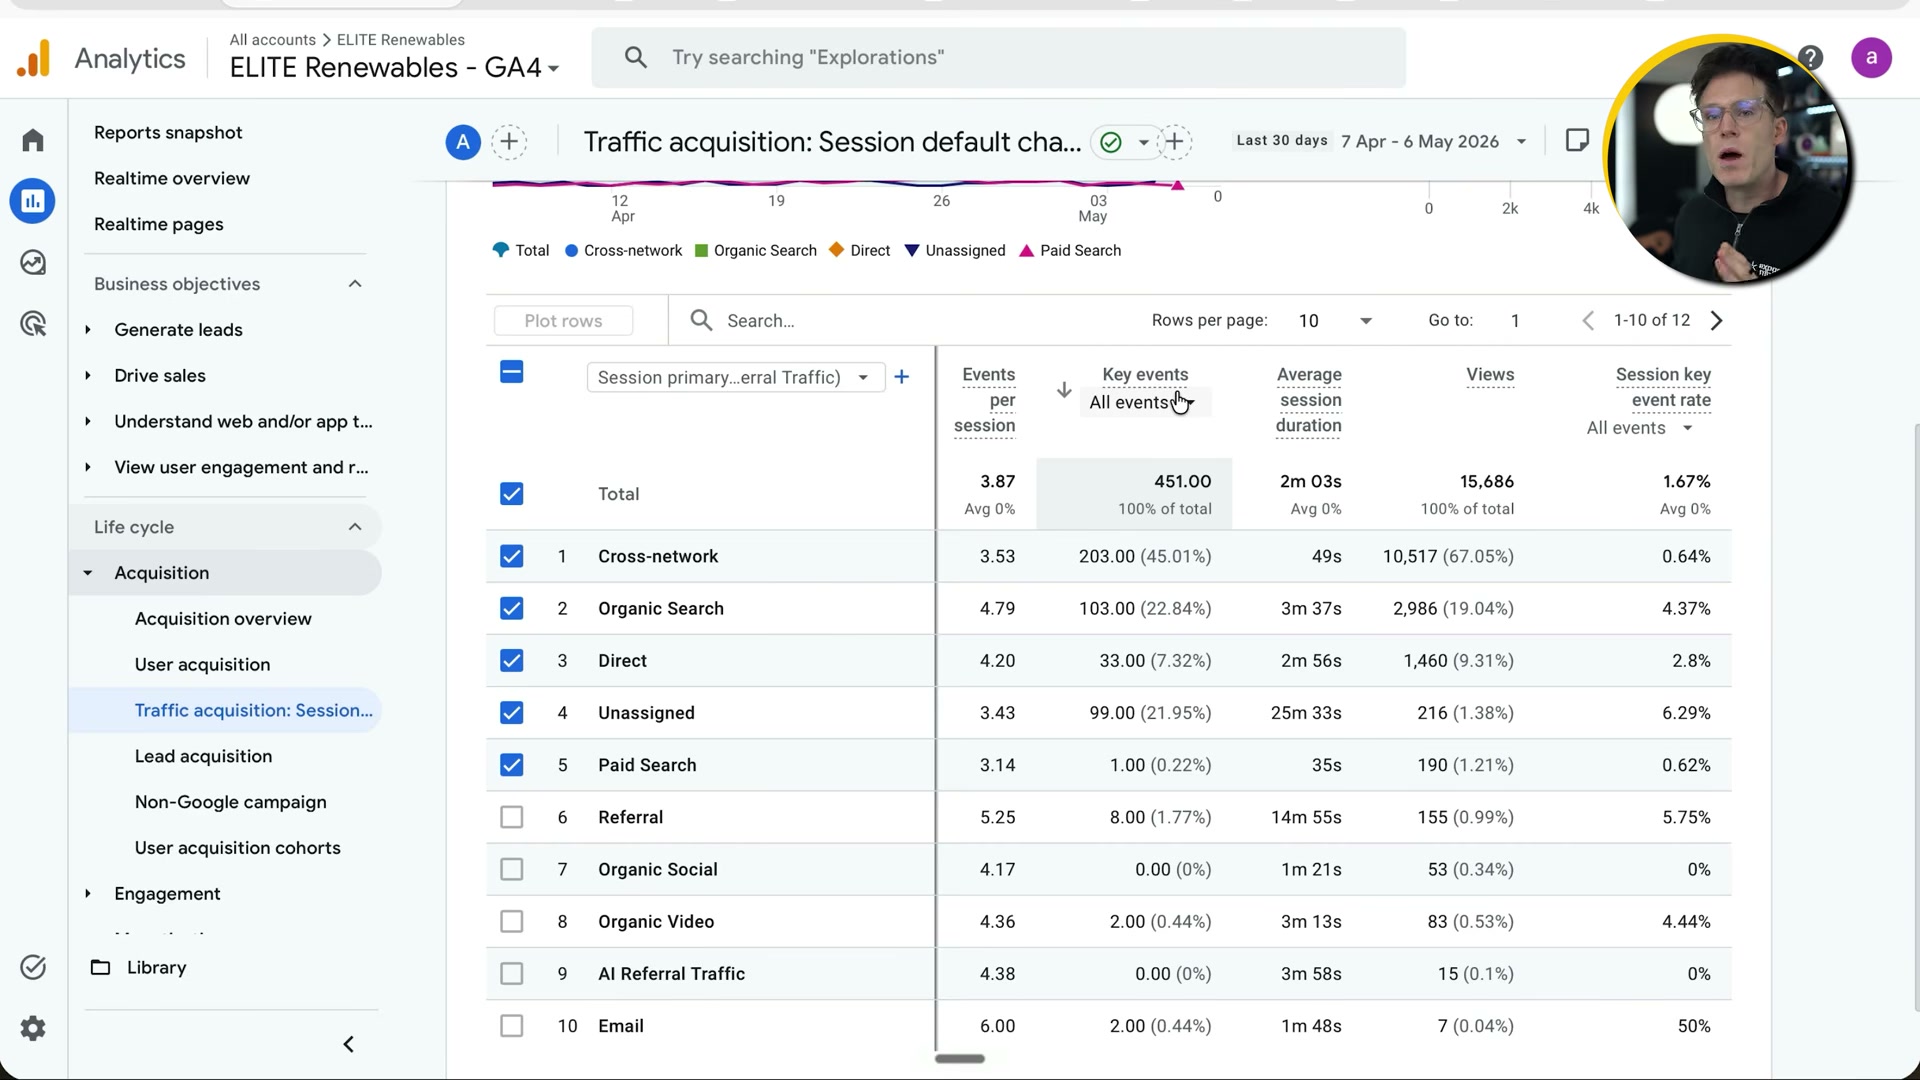
Open the Traffic Acquisition report in GA4 and evaluate each channel by comparing session volume against session key event rate. A channel driving thousands of sessions at a 0.6% key event rate tells a different story than one delivering fewer sessions at 4.3% — context about cost and intent determines which you optimize toward.
-
Navigate to Engagement → Landing Pages in GA4 to see which entry pages generate the most conversions. The homepage typically leads on volume; product and service pages often outperform it on rate when you isolate the right traffic source.
-
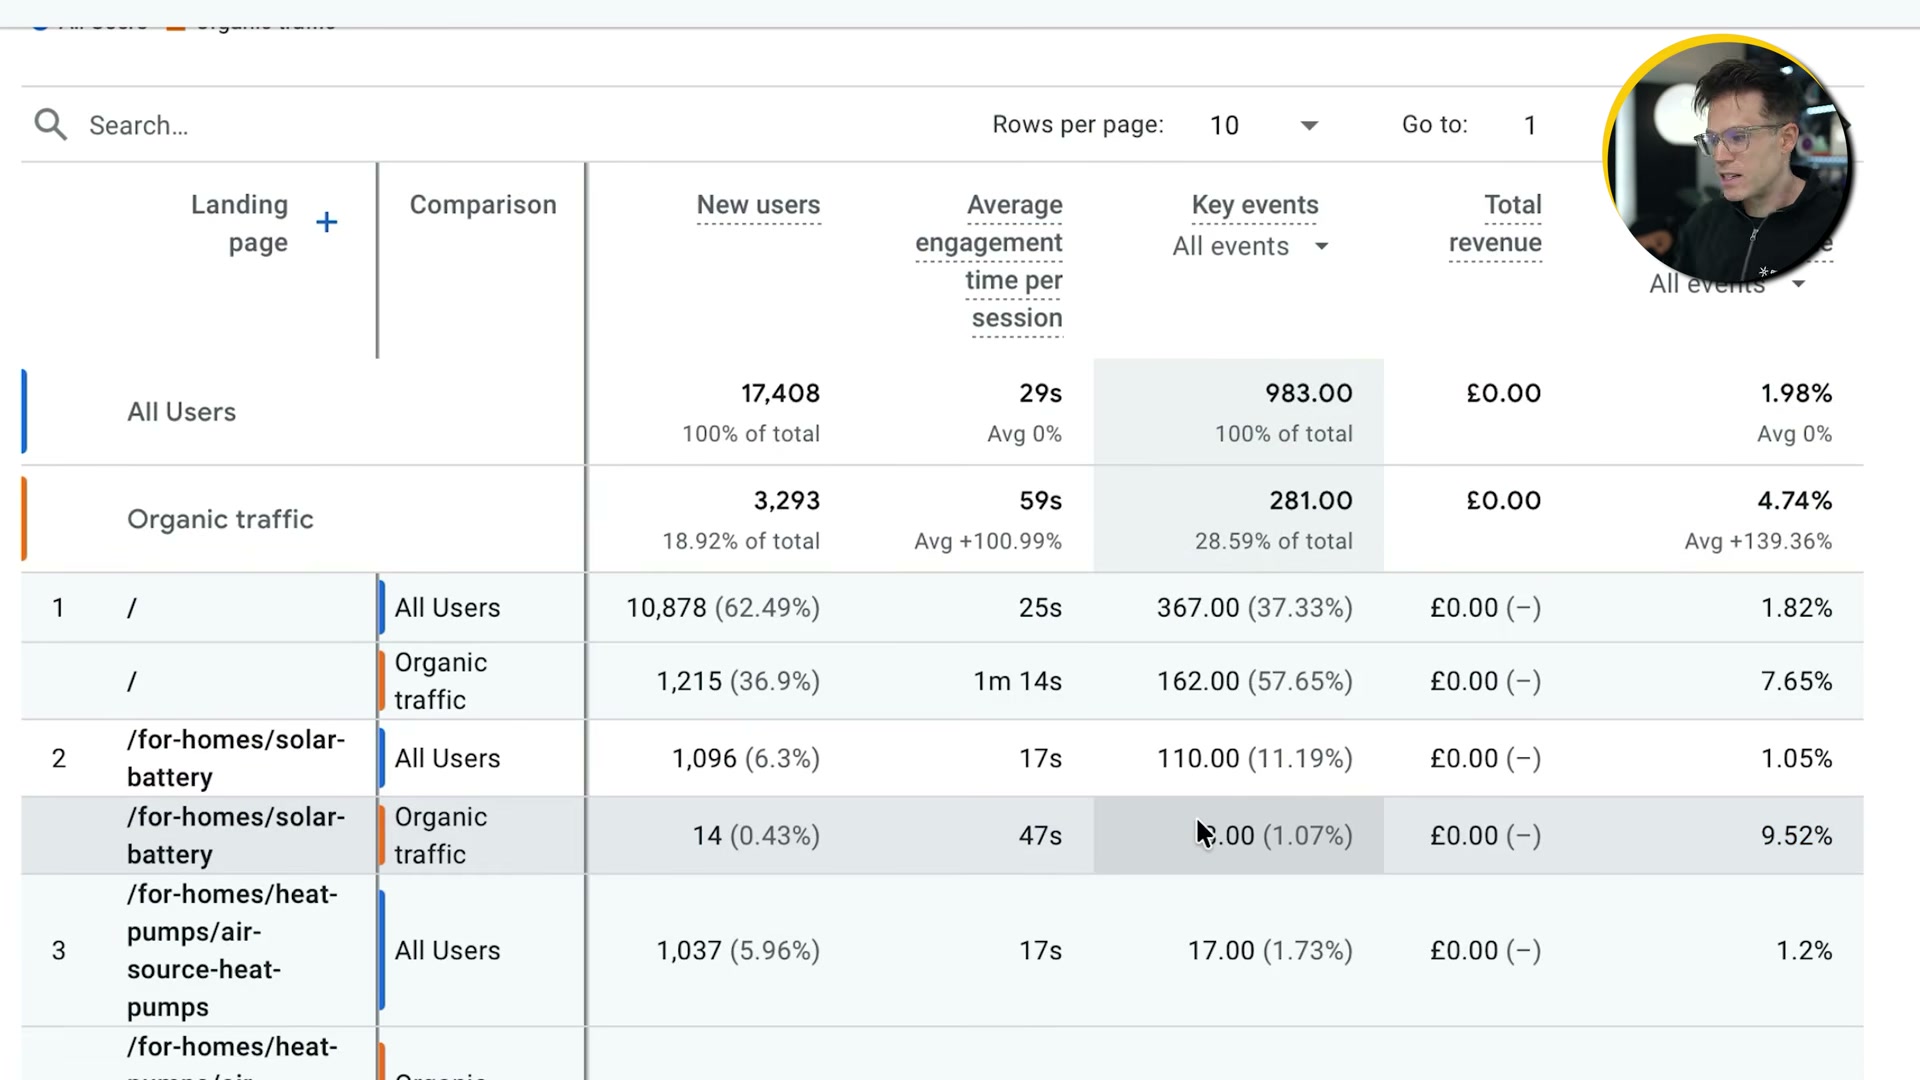
Activate the Comparison feature inside the Landing Pages report and set it to organic traffic versus all traffic. This single step frequently reveals that your best-converting page–source combinations are invisible in aggregate data — organic traffic converting at 9.52% on a page showing 1.05% for all users is not unusual.
-
For lead generation businesses, supplement GA4 with CRM data. Pull lead-to-opportunity rate, conversion-to-customer rate, and revenue per lead, broken down by acquisition channel. Without this layer, you’re optimizing for inquiries, not revenue.
-
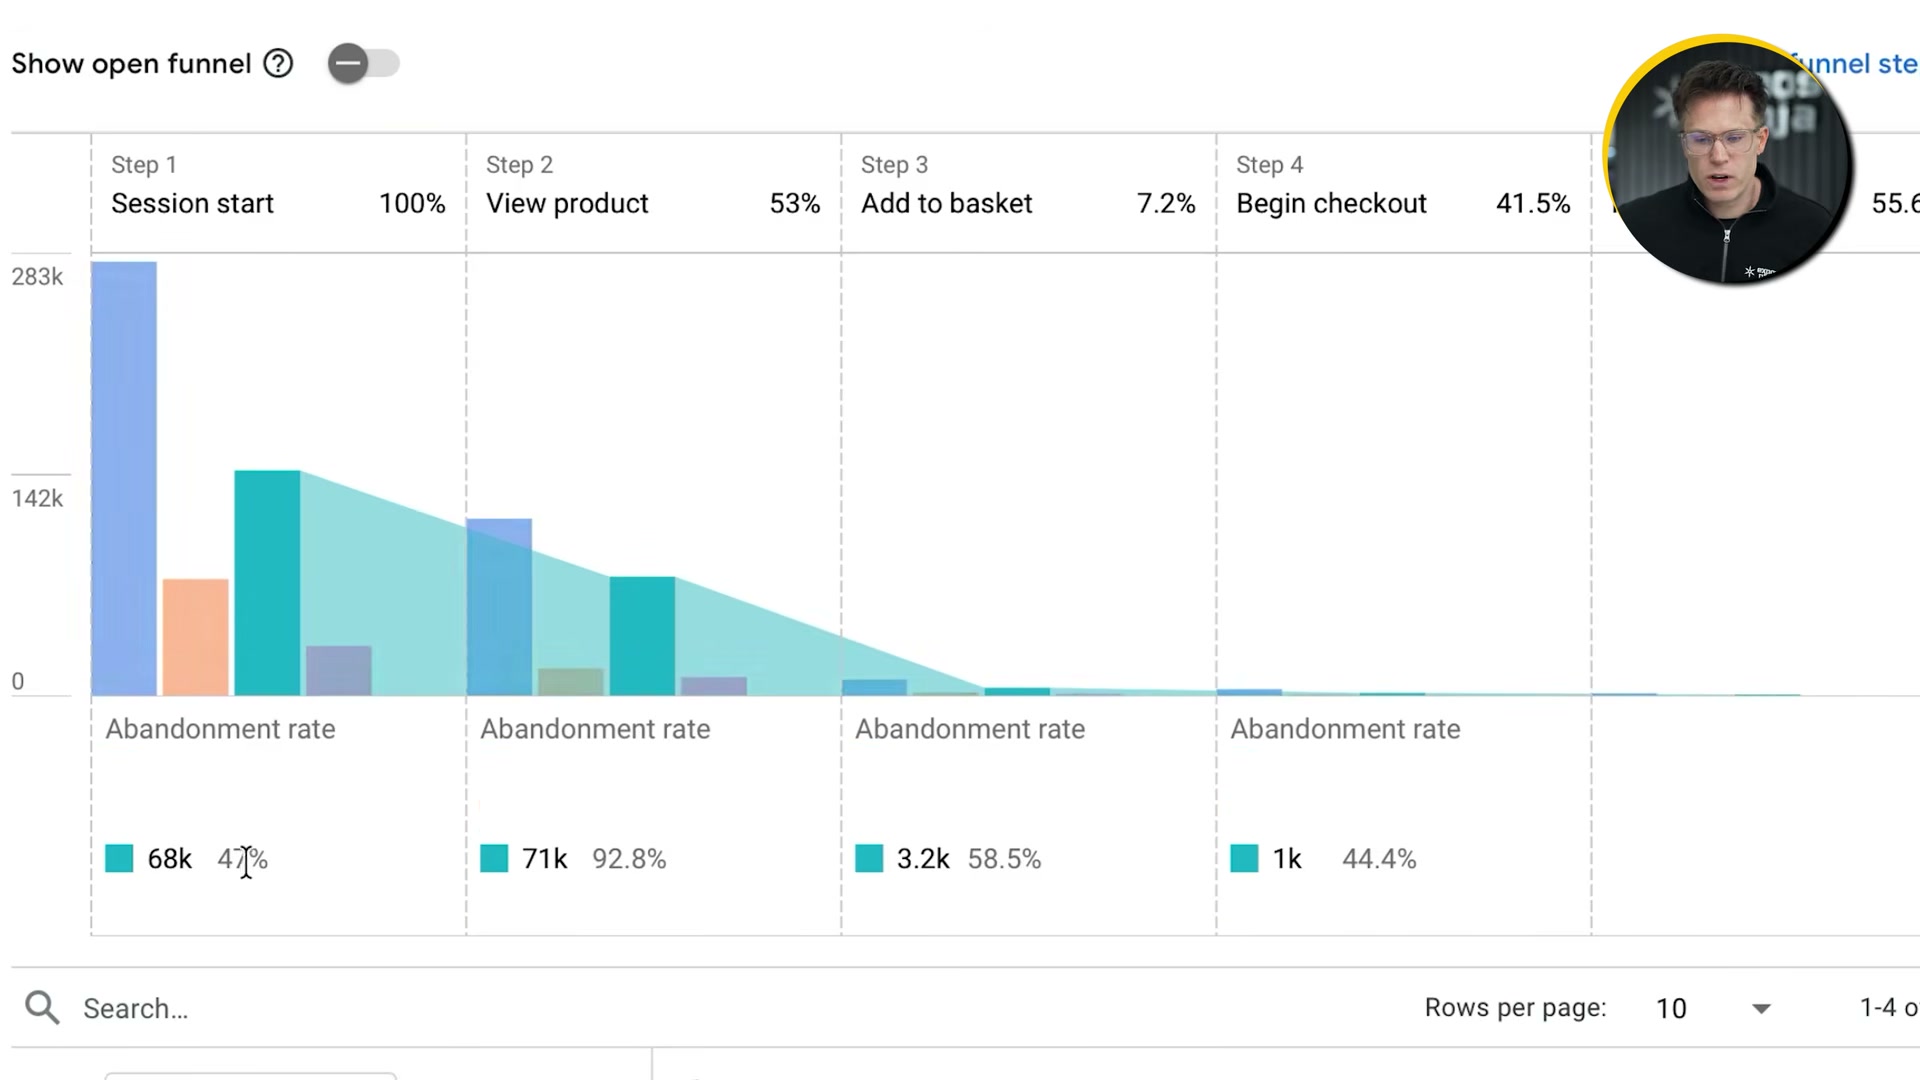
For e-commerce, go to Driving Sales → Purchase Journey in GA4 and map abandonment rates across each funnel stage: session start, product view, add to basket, begin checkout, and purchase. The product-view-to-add-to-basket step is typically where the largest drop-off occurs.

- Add channel segment comparisons — organic, paid, direct — inside the Purchase Journey report. Paid traffic with a 47% drop at session start but 92.8% abandonment at add-to-basket signals a targeting or landing page problem, not a checkout problem.
-
Layer device segmentation (mobile vs. desktop) onto the same Purchase Journey report. Mobile abandonment gaps above 15–20 percentage points over desktop are typically a site-speed or UX issue worth isolating before any other optimization.
-
Export complex cross-segmented GA4 reports as CSV and run them through an AI assistant — ChatGPT, Gemini, or Claude — to extract narrative patterns from the raw numbers.
Warning: this step may differ from current official documentation — see the verified version below.
-
In Semrush, enter your domain or a competitor’s and review total ranking keywords segmented by position bracket: 1–3, 4–10, and page 2 and beyond. Movement between brackets over time is a more reliable growth signal than raw traffic volume.
-
Track the branded versus non-branded traffic split in Semrush as a proxy for AI search visibility. A growing share of branded traffic relative to non-branded can indicate that AI-generated answers are driving name recognition without referral clicks.
Warning: this step may differ from current official documentation — see the verified version below.
How does this compare to the official docs?
Google and Semrush document these features with some meaningful differences in setup requirements, event naming conventions, and funnel configuration steps — and those gaps are exactly where Act 2 picks up.
Here’s What the Official Docs Show
Act 1 gives you a strong framework — this section adds the verification layer, confirming what the official interfaces show as of May 2026 and flagging two areas where the tools have meaningfully evolved since the tutorial was recorded. Nothing here cancels what the video walked you through; it extends it.
Step 1 — Identify your primary conversion event
No official documentation was found for this step — proceed using the video’s approach and verify independently.
Steps 2–5 — Configure key events and work the GA4 Traffic Acquisition and Landing Pages reports
No official documentation was found for these steps — proceed using the video’s approach and verify independently.

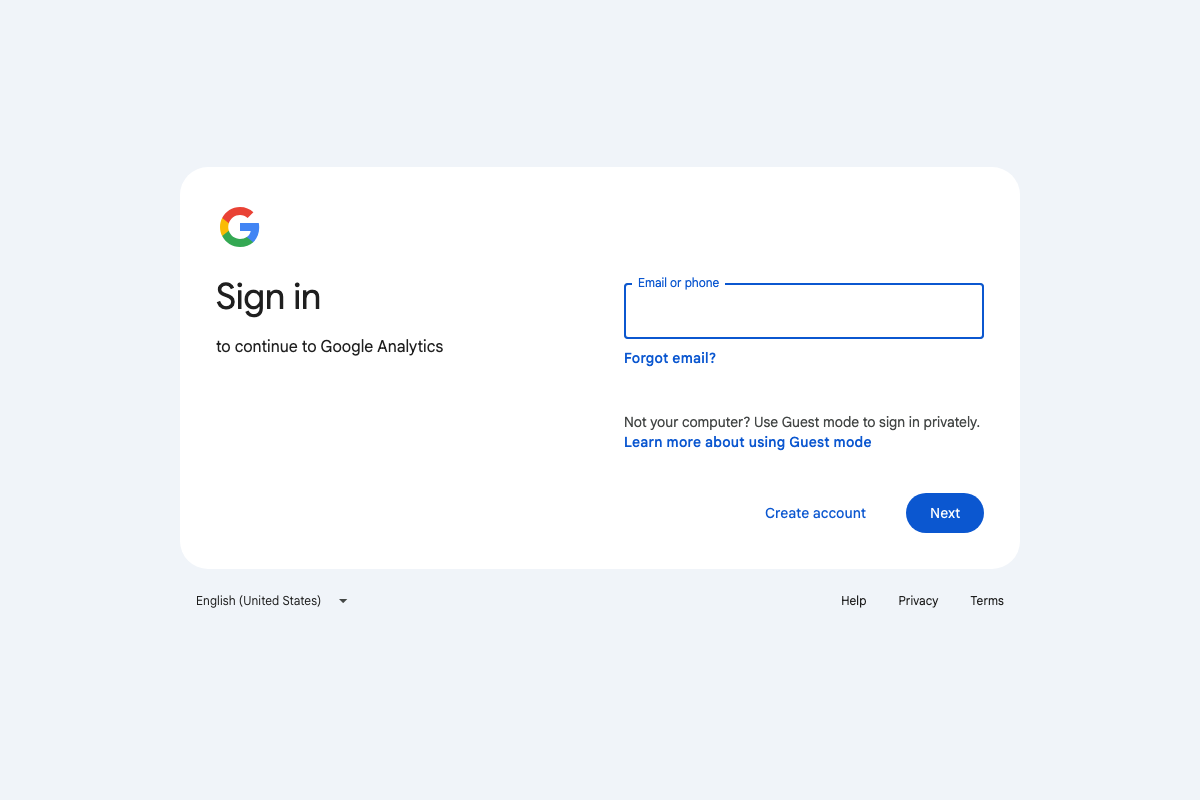
Worth knowing before you open the tool: GA4 is accessed at analytics.google.com and requires Google account authentication before any report surface is reachable. The documentation captures available for this post show only the sign-in gate — specific navigation paths, report names, and filter mechanics described in steps 2 through 9 cannot be independently confirmed here.
Step 6 — Supplement with CRM data in HubSpot
No official documentation was found for this step — proceed using the video’s approach and verify independently.
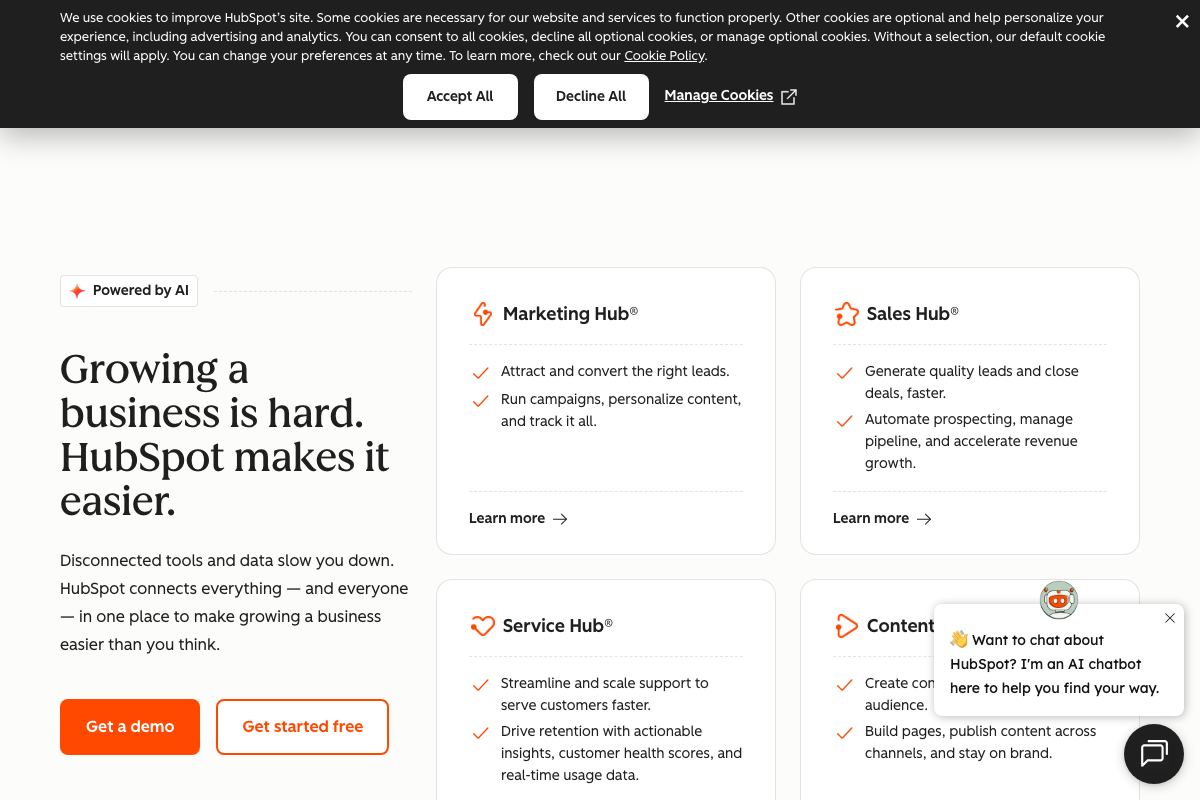
One navigational clarification: the specific reports the video describes — lead-to-opportunity rate, conversion-to-customer rate, revenue per lead by channel — live inside Sales Hub, not a generic “CRM reports” area. HubSpot now also describes itself as an “Agentic Customer Platform” with embedded AI (Breeze), a positioning shift that postdates many tutorials.
Steps 7–9 — Purchase Journey, channel segmentation, device segmentation
No official documentation was found for these steps — proceed using the video’s approach and verify independently.
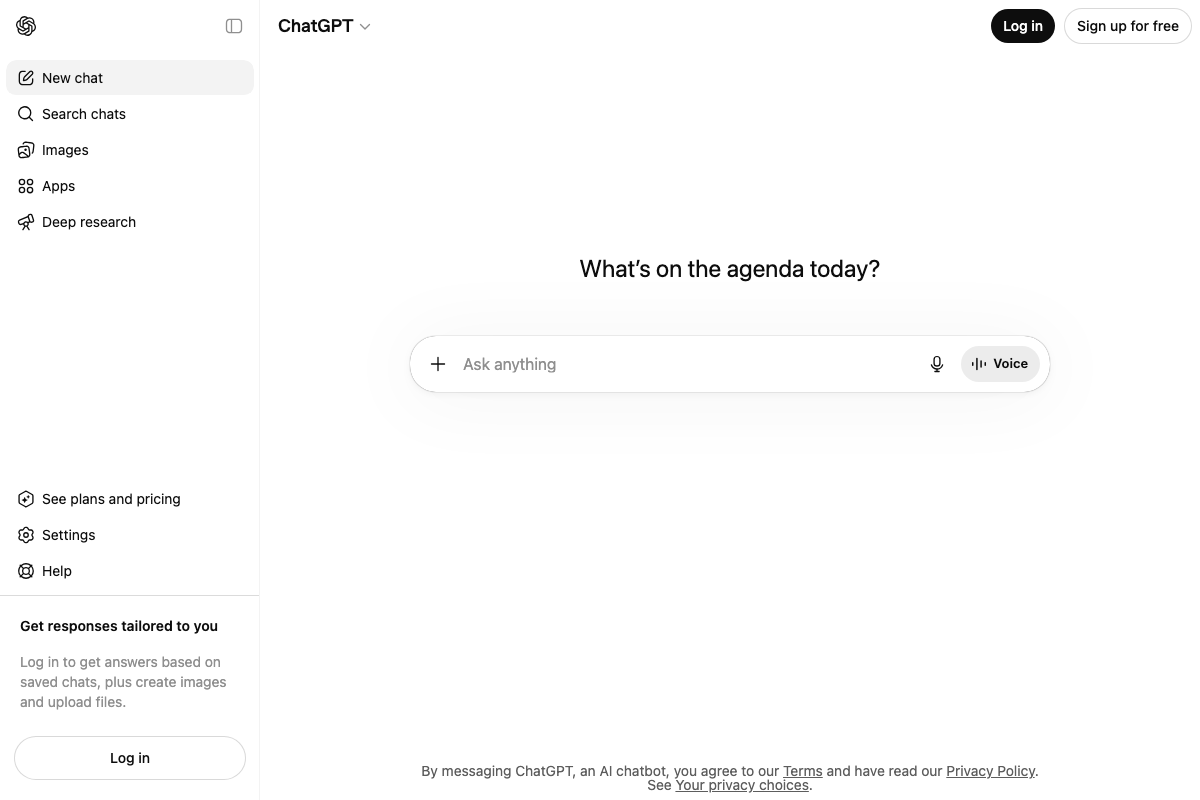
Step 10 — Export GA4 data and analyze with an AI assistant
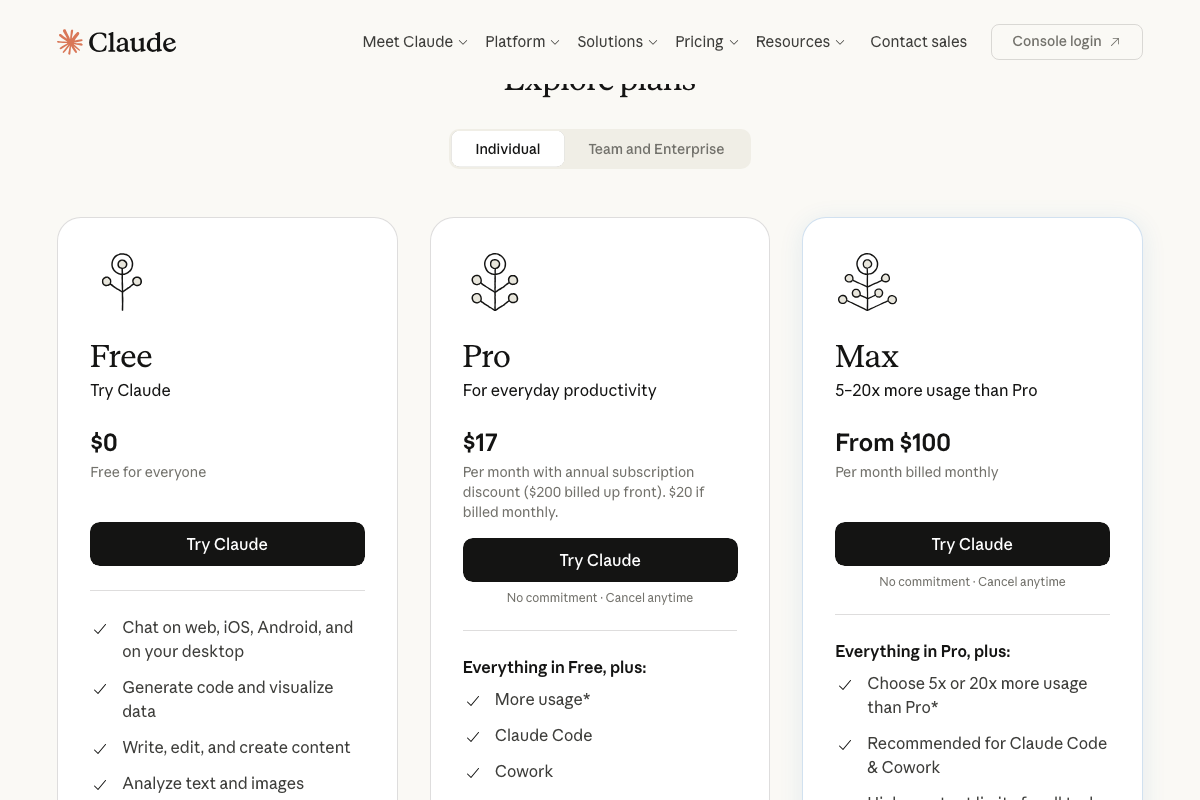
The video’s approach here matches the current docs exactly. ChatGPT accepts free-form requests at chatgpt.com; file upload for CSV imports is confirmed but requires a logged-in account — a free account is sufficient. Claude is confirmed at claude.ai, and the free tier ($0) explicitly lists “Analyze text and images,” meaning no paid subscription is required for the workflow as described.
One addition: Claude now offers a Cowork feature for autonomous task execution — a step beyond conversational analysis — that could turn a one-time CSV review into a repeatable automated report. Not required for step 10 as shown, but a meaningful upgrade path.
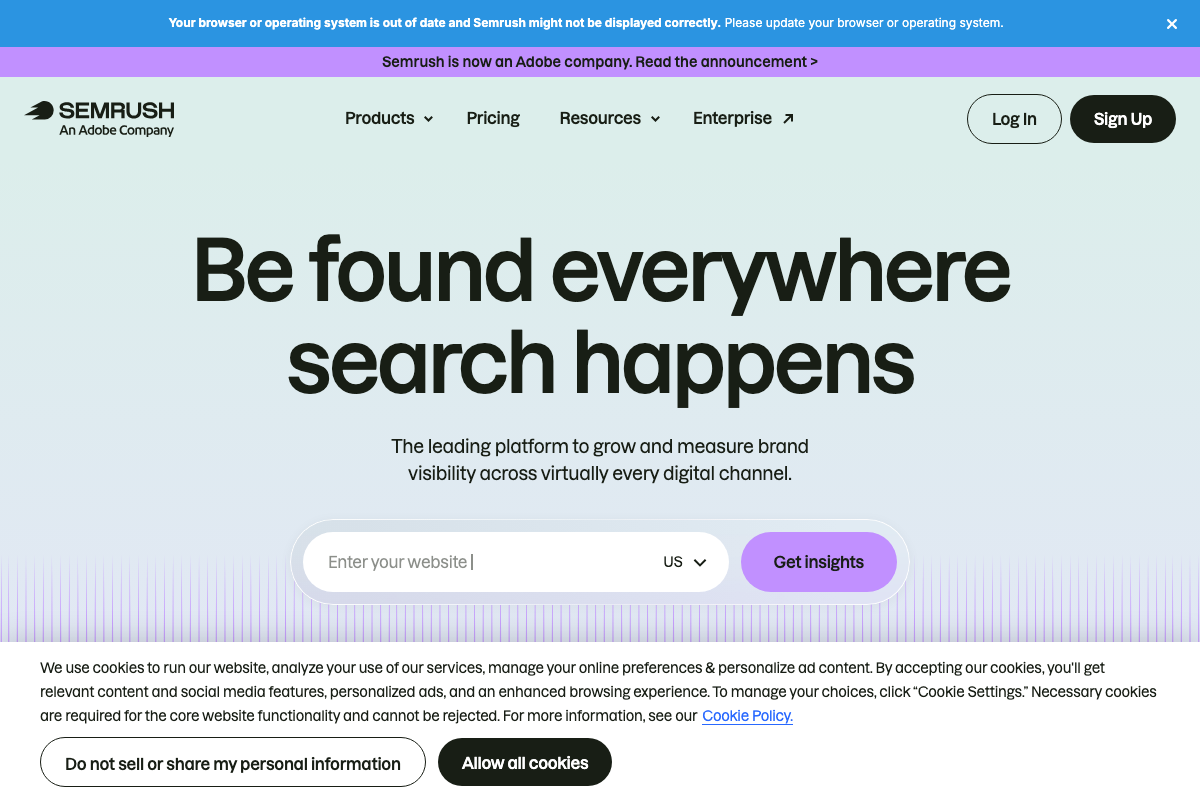
Step 11 — Semrush keyword position bracket review
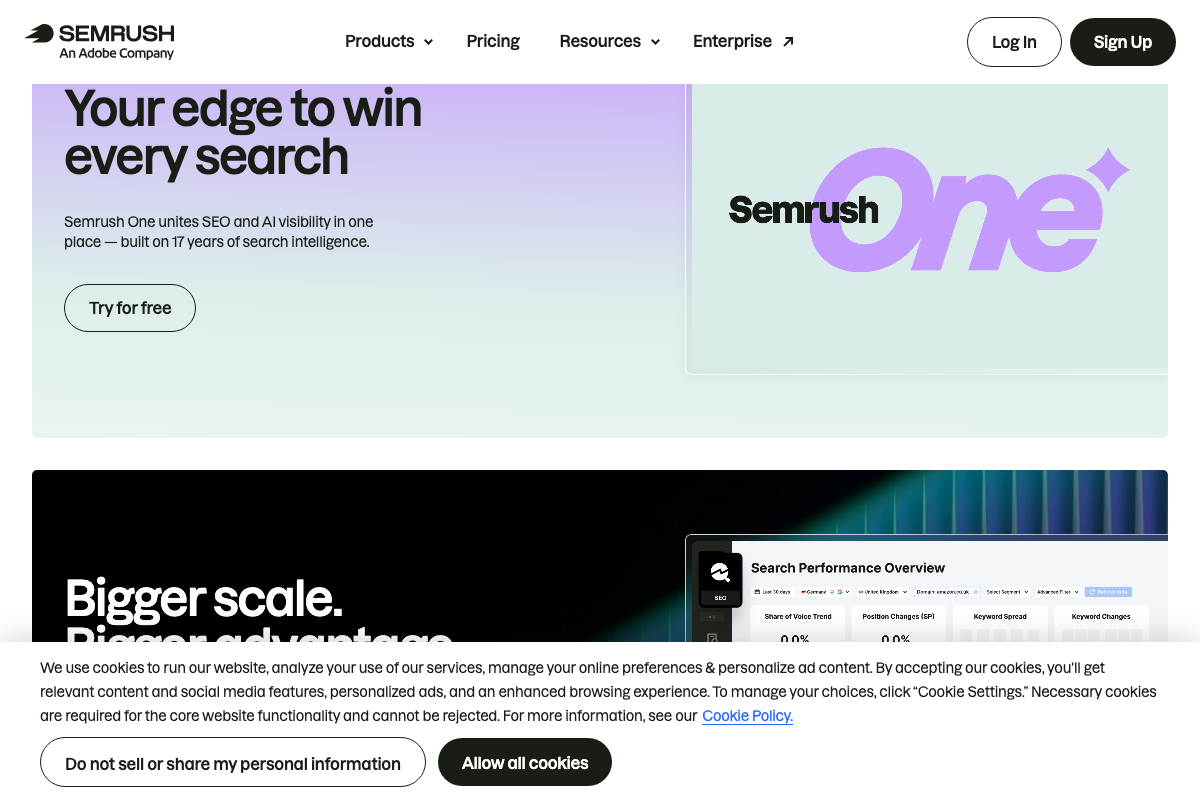
The video’s approach here matches the current docs exactly. The domain entry field on the Semrush homepage aligns with the step’s instruction to drop in a domain and review rankings. Two context updates: Semrush is now an Adobe company (confirmed by a banner on semrush.com), and a product called Semrush One now unites traditional keyword tracking with AI/LLM visibility monitoring in a single platform — adding capability beyond position-bracket review that the tutorial doesn’t cover.
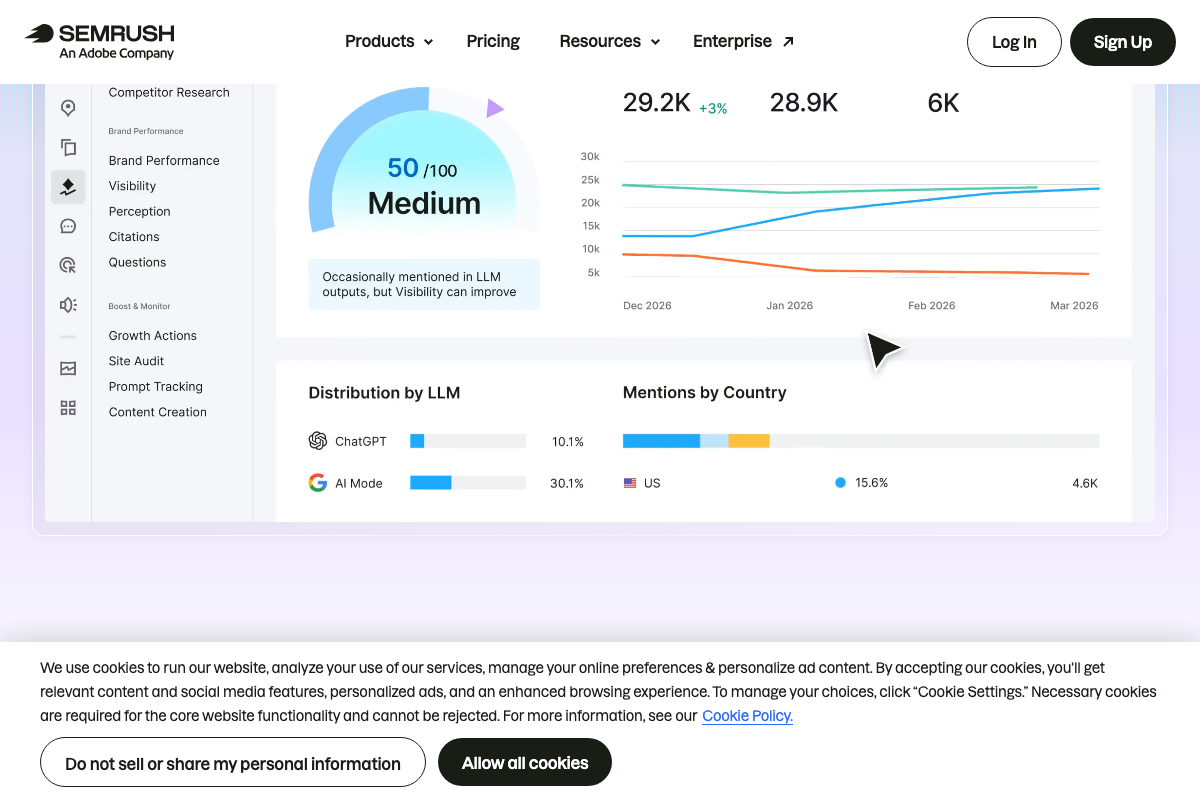
Step 12 — Branded vs. non-branded traffic split as AI visibility proxy
As of May 2026, the proxy approach is no longer the most precise method Semrush offers. The Brand Performance dashboard now provides a direct “Distribution by LLM” panel — showing per-platform AI visibility breakdowns (ChatGPT, Google AI Mode, and others) alongside a quantified 0–100 AI visibility score. Sub-sections including Visibility, Perception, Citations, Questions, and Prompt Tracking each surface distinct signals that a branded/non-branded traffic ratio cannot replicate. Use the direct dashboard instead of the proxy.
Useful Links
- Google Analytics — GA4 platform entry point; Google account authentication required before accessing any report or navigation path.
- Semrush: Your Unfair Advantage for Growing Brand Visibility — Domain research, keyword position tracking, and AI/LLM visibility dashboards including Brand Performance, Prompt Tracking, and the combined Semrush One platform.
- HubSpot | Software & Tools for your Business — CRM and marketing platform; pipeline and revenue-per-lead reporting described in step 6 resides specifically within Sales Hub.
- ChatGPT — AI assistant for data analysis; file upload requires a logged-in account; Deep Research mode available as an extended analysis option beyond simple narrative summaries.
- Claude — AI assistant and task automation platform; basic data analysis available on the free tier; Cowork feature enables autonomous workflow execution beyond conversational chat.


0 Comments