

Instagram has crossed 3 billion monthly active users and is on track to generate $42.52 billion in ad revenue in 2026—making it one of the most consequential platforms for any marketing budget. But raw scale doesn’t tell practitioners what actually works. This tutorial breaks down the most actionable 2026 Instagram statistics and shows you exactly how to translate them into a strategy that drives measurable results.
What This Is
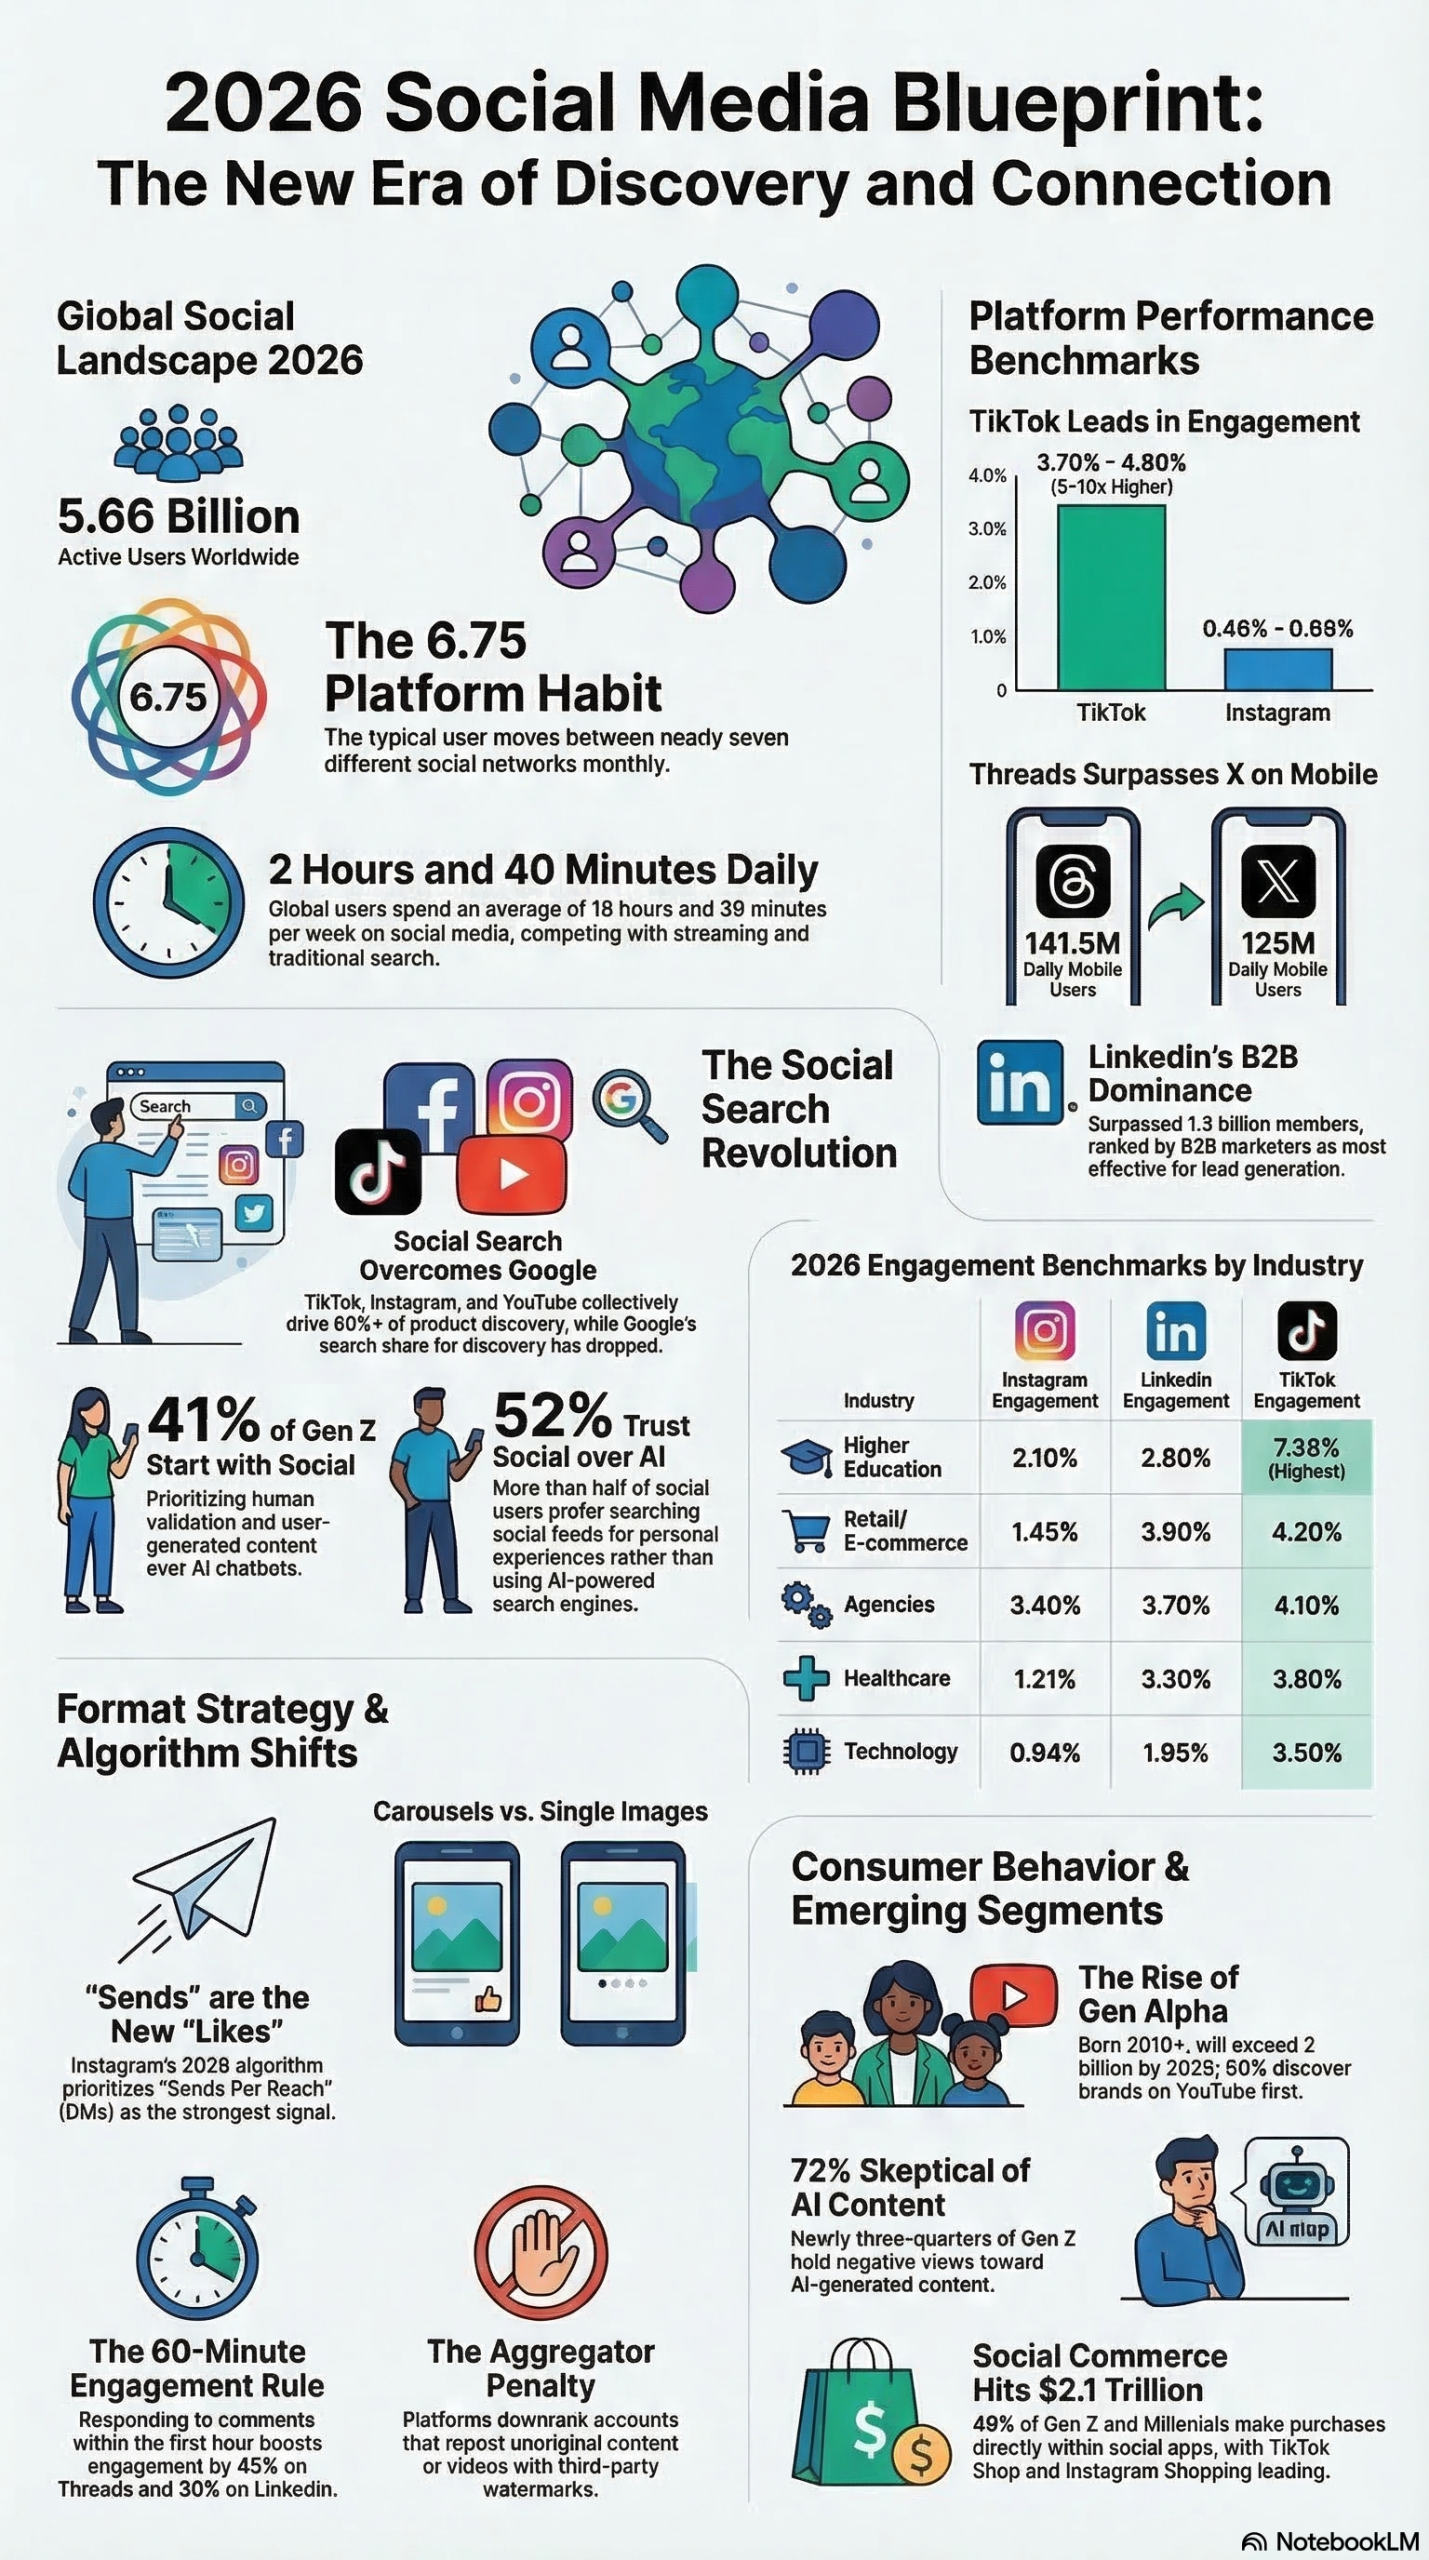
Instagram’s 2026 statistical profile isn’t just an update—it’s a fundamentally different platform than what marketers mapped their strategies to in 2022 or 2023. Hootsuite’s annual Instagram statistics report, published March 17, 2026, catalogs more than 30 data points across user behavior, content performance, advertising efficiency, and commerce conversion. Combined with the broader social media landscape analysis from NotebookLM research on the 2026 social media landscape, this report reveals a platform mid-transformation.
Here’s what that transformation looks like in concrete terms:
The platform’s scale is not in question. Instagram is the world’s third most-used social platform (tied with WhatsApp), the fourth most-visited website globally, and home to 3 billion monthly active users. India leads with 390+ million users, followed by the U.S. at 170 million and Brazil at 140 million. In the United States, 80% of adults aged 18–29 use Instagram, a penetration rate that makes it non-optional for any brand targeting young adults.
But the engagement mechanics have fundamentally shifted. According to the NotebookLM research report, while Reels posting volume is up 35%, unique reach has declined by approximately 31%. The platform has moved to a unified “Views” metric (including repeat views) as the primary performance currency, and standard likes have dropped by nearly 48%. Comments are up 7% and shares are up 11%—the platform is rewarding depth of engagement, not breadth.
The content format hierarchy is now clear. Reels account for 46% of all time spent on Instagram and are reshared 4.5 billion times daily. Carousels, meanwhile, deliver 3x the impressions of single-image posts. Stories remain the retention engine for existing audiences. This isn’t a matter of personal preference—the algorithm has a documented hierarchy, and practitioners who don’t align to it fight an uphill battle.
Commerce is no longer a sidebar feature. 47% of U.S. social buyers are expected to shop on Instagram in 2026. Eighty percent of Instagram users already follow at least one business account. Fifty percent of users discover new brands while scrolling their feed. The distance between discovery and purchase has collapsed, and the platforms—and the data—reflect that.
Understanding these numbers is the starting point. Using them to architect an actual strategy is what the rest of this post is about.
Why It Matters
The shift in Instagram’s metrics isn’t cosmetic—it changes which strategies generate ROI and which ones drain budget. Here’s what this data means for practitioners operating in specific roles:
For brand marketers and content teams: The decline in likes and rise in shares/sends is a signal, not a curiosity. The NotebookLM research report identifies “Sends” (private DM sharing) as the strongest signal of content value on the platform, indicating high distributability to new audiences. If your team is still optimizing for likes and saves, you’re chasing a metric that’s losing algorithmic weight. Redesigning content to be “send-worthy”—meaning genuinely useful, relatable, or surprising enough that someone would forward it to a friend—is the new brief.
For performance marketers and media buyers: Instagram’s $42.52 billion in projected 2026 ad revenue, representing over 53% of Meta’s total ad revenue, reflects the platform’s increasing efficiency as a paid channel. More than 50% of Instagram ads now run on Reels. If your creative strategy isn’t Reels-native—shot vertically, front-loaded, 7–15 seconds for maximum completion—you’re paying Reels prices for non-Reels performance.
For e-commerce and DTC brands: The 47% U.S. social buyer penetration figure and the 25% reduction in return rates from AI-powered AR virtual try-ons (noted in the NotebookLM research report) point to a platform where friction removal is the core commercial lever. Brands that have moved to in-app “comment-to-DM” checkout flows are bypassing the link-in-bio bottleneck entirely.
For agencies and consultants: Your clients are going to see metrics they don’t understand—declining likes alongside increasing reach, or high view counts with low comment volume. The 2026 statistics give you the framework to explain platform-level shifts rather than defending your content quality. The benchmark average engagement rate on Instagram is 0.48%–0.98%—well below what most clients expect from past years. Setting those expectations correctly, with data to back it up, protects your client relationships.
What makes 2026 different from 2023: The platform has moved from a social graph (distribution based on follower relationships) to an interest graph (distribution based on topic relevance). As Gary Vaynerchuk noted in reporting cited by the NotebookLM research: “Interest media depends on content that attracts attention based on the subject matter and message. It doesn’t matter whether the creator is familiar to the viewer.” For brands with large follower counts but low engagement, that’s not reassuring—but it opens a real opportunity for brands willing to produce genuinely valuable content.
The Data
2026 Instagram Performance Benchmarks vs. Platform Averages
| Metric | 2026 Instagram Benchmark | Notes |
|---|---|---|
| Monthly Active Users | 3 billion | Third most-used platform globally |
| Average Engagement Rate | 0.48%–0.98% | Carousels outperform; Reels for discovery |
| Reels Average Engagement | 2.8% | Highest format-specific rate |
| Reels Daily Reshares | 4.5 billion | Primary discovery mechanism |
| Time Spent on Reels | 46% of total session | Dominant content format |
| Projected Ad Revenue | $42.52 billion | 53%+ of Meta’s total |
| U.S. Adults (18–29) on Instagram | 80% | Highest penetration demographic |
| Users Following Business Accounts | 80% | High commercial intent |
| Users Discovering Brands via Feed | 50% | Discovery-to-purchase path active |
| U.S. Social Buyers Expected to Shop | 47% | Strong commerce conversion |
| Likes Decline (YoY) | -48% | Dying metric |
| Comments Growth (YoY) | +7% | Rising quality signal |
| Shares Growth (YoY) | +11% | Rising quality signal |
| Reels Volume Growth (YoY) | +35% | More supply; reach down 31% |
| Unique Reach Decline (YoY) | -31% | “Reach recession” underway |
Sources: Hootsuite Instagram Statistics 2026 and NotebookLM 2026 Social Media Landscape Report
Instagram vs. Other Major Platforms (2026 Engagement Benchmarks)
| Platform | Avg. Engagement Rate | Top Format | Strategic Priority |
|---|---|---|---|
| 0.48%–0.98% | Carousels & Reels | Carousels for depth; Reels for discovery | |
| TikTok | 3.70%–4.90% | Short-form Video (7–15s) | Entertainment-led discovery |
| 2.05% (up to 6.5%) | PDF Carousels | B2B brand awareness | |
| 0.15% | Short-form Video | Product discovery; customer support | |
| X (Twitter) | 0.03% | Short Text / Video | Real-time news; high male skew |
Source: NotebookLM 2026 Social Media Landscape Research Report
Step-by-Step Tutorial: Building a 2026 Instagram Strategy from the Data
This is the practical part. Here’s exactly how to turn these statistics into a working content and advertising system.
Prerequisites
Before you start, you need:
– A business or creator account on Instagram (required for analytics access)
– Access to Instagram Insights (native) or a third-party analytics tool (Hootsuite, Sprout Social, or Iconosquare)
– A 90-day baseline of your own performance data to compare against platform benchmarks
– A clear content objective: discovery (Reels), retention (Stories), or commerce (product tags + DM flows)
Phase 1: Audit Your Current Metrics Against 2026 Benchmarks
Step 1: Pull your engagement rate by format.
In Instagram Insights, navigate to Content → Filter by content type (Posts, Reels, Stories). Calculate your engagement rate for each format: (Likes + Comments + Shares + Saves) / Reach × 100.
Compare your numbers to the 2026 benchmarks:
– Standard posts/carousels: industry benchmark 0.48%–0.98%
– Reels: industry benchmark 2.8%
If your Reels are below 1.5%, your hook or completion rate is the problem. If your standard posts are below 0.4%, you’re likely producing content optimized for a format (single images) that the algorithm has deprioritized.
Step 2: Check your Sends/Shares ratio.
According to the NotebookLM research report, private DM shares (“Sends”) are now the most weighted engagement signal on Instagram. In Instagram Insights, this appears as “Shares” in your post metrics. Calculate what percentage of your total engagements are shares. If shares represent less than 5% of total engagement, your content isn’t reaching “send-worthy” threshold.
Step 3: Document your current follower-to-reach ratio.
Go to any recent post and check Reach vs. Follower count. In 2026, organic reach of 10–20% of followers is reasonable; anything below 5% suggests a content-relevance mismatch (the algorithm isn’t categorizing your account correctly).
Phase 2: Restructure Your Content Mix
Step 4: Implement the 50/30/20 Format Split.
Based on the 2026 performance data, allocate your content production:
– 50% Reels — optimized for discovery. These should target non-followers by using keyword-rich captions and topically specific hooks.
– 30% Carousels — optimized for depth and saves. Use the full 20-slide limit to create mini-guides, how-to walkthroughs, or data-rich content that earns saves.
– 20% Stories — optimized for retention and interactive engagement with existing followers. Use polls, quizzes, and question stickers to generate the engagement signals that feed the algorithm.
Step 5: Apply the 2-Second Hook Rule to every Reel.
The NotebookLM research report is explicit: Reels that surface the core benefit in the first 2 seconds have significantly higher completion rates. Cut every intro. The first frame should show the outcome, the problem being solved, or the most visually arresting moment in the video. Test the hook by watching your Reel with the sound off—if the first frame doesn’t communicate value immediately, re-edit.
Step 6: Build carousels as mini-guides.
Hootsuite’s 2026 data and the NotebookLM report confirm that carousels deliver 3x the impressions of single-image posts. The mechanism: each swipe is a re-engagement signal that extends the algorithm’s distribution window. Structure your carousels:
– Slide 1: Bold claim or question (drives the swipe)
– Slides 2–18: The actual value (step-by-step, data, comparisons)
– Slide 19: Summary/takeaway
– Slide 20: CTA (follow, share, DM for the full resource)
Phase 3: Implement Social SEO
Step 7: Treat every caption like a blog header.
As documented in the NotebookLM research report, Instagram captions are now indexed by both the platform algorithm and Google. Stop writing captions as afterthoughts. Write them as keyword-rich descriptions of the content topic. Lead with the primary keyword in the first line (visible before “more” truncation). Example: instead of “Had so much fun creating this ✨”, write “Instagram carousel strategy for 2026: here’s the exact structure we use to get 3x impressions.”
Step 8: Optimize hashtag usage.
The Hootsuite report specifies the optimal hashtag count as 3–5 tags. More than that dilutes topical relevance. Use:
– 1 niche-specific tag (e.g., #InstagramMarketing)
– 1 topic tag (e.g., #ContentStrategy)
– 1 community tag (e.g., #MarketingTips)
Avoid massive generic hashtags (#marketing, #business) where your content disappears instantly.
Step 9: Maintain account-level topical consistency.
The NotebookLM research report notes that Instagram’s algorithm categorizes accounts based on their last 9–12 posts. If you post across multiple unrelated topics, the algorithm can’t reliably identify your “Audience Fit” and distribution narrows. Ensure your last 12 posts stay within 2–3 related topic clusters.
Phase 4: Build the Commerce Layer
Step 10: Set up product tags on every eligible post.
With 47% of U.S. social buyers expected to shop on Instagram in 2026 and 50% already discovering brands via feed, any e-commerce brand not using native product tags is leaving conversions on the table. In Commerce Manager (linked to your Instagram business account), tag products in every Reel and carousel where the product is visible or referenced.
Step 11: Replace “link in bio” with comment-to-DM automation.
The NotebookLM research report identifies comment-to-checkout DM chatbot flows as the highest-converting commerce funnel on Instagram in 2026, bypassing landing pages and reducing friction. Tools like ManyChat or Manychat’s Meta-integrated flows allow you to trigger an automated DM whenever someone comments a specific keyword. Set this up:
– Post a Reel or carousel with a CTA (“Comment ‘GUIDE’ and I’ll send you the full breakdown”)
– Automate a DM that delivers the resource and includes a product link or checkout link
– Track conversion from DM opens to purchase in your commerce dashboard
Step 12: Use Stories for retention, not discovery.
Stories are not indexed by the algorithm for non-follower distribution. Their value is retention and relationship depth with your existing audience. The NotebookLM research recommends using Stories’ interactive stickers (polls, quizzes, question boxes) to generate the algorithm-positive engagement signals that validate your existing community’s health.
Phase 5: Set Up Paid Amplification
Step 13: Run Reels-native ads.
More than 50% of Instagram ads already run on Reels. If you’re boosting standard posts, you’re using legacy ad inventory. Create ads that look organic—shot vertically, no logo watermarks in the first 2 seconds, immediate value in the hook. Use the 7–15 second sweet spot for awareness campaigns and allow 30–60 seconds for retargeting audiences who have already engaged.
Step 14: Layer audience targeting with behavioral data.
Given that 60% of product discovery now occurs on social platforms rather than Google, your Meta Ads audience strategy should prioritize interest-graph signals over demographic targeting. Build custom audiences from:
– Instagram profile visitors (last 30 days)
– Reel video viewers (50%+ completion)
– Instagram shop visitors
Then build lookalikes from your highest-intent converters.
Expected Outcomes
After 90 days of implementing this system, you should see:
– Reels engagement rate moving toward the 2.8% benchmark
– Shares/Sends increasing as a percentage of total engagement
– Organic reach stabilizing as account topical consistency improves
– Comment-to-DM conversion rates of 15–25% on well-structured CTA posts
– Reduced CPM on Reels ads as creative quality improves (Meta rewards completion rates with lower CPMs)
Real-World Use Cases
Use Case 1: DTC Skincare Brand — Commerce Conversion
Scenario: A direct-to-consumer skincare brand with 45,000 followers struggling with declining organic reach and poor “link in bio” click-through rates.
Implementation: The brand restructures to a Reels-first posting schedule (4 Reels/week), each ending with “Comment ‘SKIN’ for our full routine breakdown.” ManyChat automation delivers a DM with a curated routine and a direct shop link. They enable product tags on every post and activate Instagram’s native AR try-on for their foundation line.
Expected Outcome: Based on Hootsuite’s reported 47% U.S. social buyer penetration and the research report’s documented 25% return rate reduction from AR try-ons, this brand can expect measurable improvement in both conversion rate and post-purchase satisfaction within 60 days.
Use Case 2: B2B SaaS Company — Thought Leadership via Carousels
Scenario: A B2B software company trying to generate marketing-qualified leads from organic Instagram content targeting startup founders and marketing directors.
Implementation: They produce 2 carousels per week: each one a data-driven mini-guide (e.g., “7 metrics your Instagram ads dashboard isn’t showing you”). Slides are structured with a stat-forward hook, step-by-step explanation, and a final CTA slide offering a downloadable benchmark report via DM. Captions are written with keyword-rich first lines targeting searches like “Instagram ad benchmarks 2026.”
Expected Outcome: Carousels’ documented 3x impression advantage over single images, combined with Social SEO optimization, positions these posts for both algorithmic distribution and Google indexing. Lead quality improves because the DM flow pre-qualifies interest.
Use Case 3: Creator/Influencer — Maximizing “Sends” for Organic Growth
Scenario: A marketing consultant with 12,000 followers trying to break into the 50K+ tier without paid promotion.
Implementation: They audit their last 30 posts and identify their highest-Sends content. The common thread: posts that call out a counterintuitive industry truth or deliver a condensed, “screenshot-worthy” insight. They restructure their entire content calendar around content designed to be forwarded—contrarian takes, surprising statistics presented visually, rapid-fire tip carousels.
Expected Outcome: As the NotebookLM research report confirms, Sends are the strongest algorithmic signal for distributability to new audiences. A consistent focus on send-worthy content compounds: each viral DM share introduces the account to potential new followers who are already pre-sold on the content quality.
Use Case 4: Retail Brand — In-Store + Instagram Integration
Scenario: A mid-size fashion retailer with 80 physical locations and an Instagram presence that isn’t driving foot traffic or online sales.
Implementation: The brand launches a weekly Reels series featuring in-store staff styling outfits from new arrivals. Each Reel uses product tags that link directly to the product in the Instagram shop. Stories feature “swipe up” location stickers for the nearest store and run weekly polls asking followers to vote on next week’s featured style.
Expected Outcome: 80% of Instagram users already follow business accounts, and 78% of consumers say creators help them discover brands. Featuring real staff (not hired influencers) leverages the “Human Premium” documented in the research—72% of Gen Z are skeptical of AI-generated content, and authentic human-led content consistently outperforms polished brand content.
Use Case 5: News/Media Publisher — Social Search Optimization
Scenario: A digital media publication trying to replace traffic lost from Google’s declining search share (down to 34.5% of product/information discovery) with Instagram-sourced readers.
Implementation: The publisher restructures its Instagram content to front-run trending news topics with fast-turnaround carousels. Each carousel caption is written as a keyword-dense summary (the caption functions as both algorithm signal and Google index fodder). They post within 2 hours of breaking news in their niche to capture organic interest-graph traffic before competitors.
Expected Outcome: 60% of product and information discovery now occurs on social platforms, and 20% of U.S. adults already get news regularly on Instagram. Fast, SEO-optimized carousels position the publication as a primary source in users’ interest-graph discovery feeds.
Common Pitfalls
Pitfall 1: Optimizing for Likes
Likes have dropped nearly 48% year-over-year, according to the NotebookLM research report. Brands still using likes as their primary engagement KPI are chasing a metric the platform has de-weighted algorithmically. Shift your reporting dashboard to Shares, Sends, Comments, and Watch Time. If you’re presenting to stakeholders, include a clear explanation of why the metric shift reflects platform maturity, not content decline.
Pitfall 2: Watermarked TikTok Reposts
Adam Mosseri has explicitly stated (contextualized in Sprout Social reporting) that Instagram actively penalizes accounts that repost content from other platforms without adding significant original value. Watermarked TikTok videos uploaded to Reels receive dramatically reduced distribution. If you’re cross-posting, re-export from your original files and produce platform-native versions.
Pitfall 3: Inconsistent Posting Topic Clusters
As documented in the NotebookLM research, Instagram’s algorithm uses your last 9–12 posts to categorize your account’s topic relevance. Brands that jump between unrelated topics (a recipe post followed by a business tip followed by a product announcement) create an inconsistent interest-graph profile. The algorithm can’t reliably identify your audience, so it defaults to narrower distribution. Maintain 2–3 tightly related content pillars.
Pitfall 4: Ignoring the Mobile-First Reality
98–99% of social media users access platforms via mobile. Yet many brands still produce creative assets sized for desktop, then adapt. Start with 9:16 vertical ratios for Reels, 1:1 for feed posts, and ensure all text is legible at mobile font sizes. Reviewing creative on actual phone screens before publishing is non-negotiable.
Pitfall 5: Using Too Many Hashtags
The optimal hashtag count per Hootsuite’s 2026 data is 3–5. Accounts still using 20–30 hashtags are not only wasting caption space—they’re signaling to the algorithm that the post lacks a clear topical identity. Three highly relevant, niche-specific hashtags outperform thirty generic ones every time.
Expert Tips
Tip 1: Engineer for “Sends,” not saves. Saves have historically been the power metric for carousel performance. In 2026, the research confirms that Sends carry more algorithmic weight. Design content with a “would I forward this?” filter. Relatable pain points, surprising data visualizations, and actionable frameworks in carousel format reliably drive DM shares.
Tip 2: Use the comment section as a distribution lever. Comment volume is up 7% platform-wide. Posting a genuinely interesting question in your caption—or being the first to respond to every comment within 60 minutes of posting—artificially extends the engagement window that signals to the algorithm that the post is worth continued distribution. Responding within an hour increases engagement by measurable percentages on most platforms.
Tip 3: A/B test Reel hooks before scaling with paid. Before spending budget amplifying a Reel, post it organically and track 3-second watch-through rate. If it’s below 40%, the hook isn’t working—revise and repost rather than boosting a broken asset. Only amplify Reels that have already demonstrated organic completion.
Tip 4: Leverage creator content over branded production. 78% of consumers say creators help them discover brands, and 72% of Gen Z are skeptical of AI-generated or overly polished content. A single authentic creator collaboration often outperforms a high-production brand shoot—both in organic distribution and in paid amplification efficiency, because the content reads as native to the feed.
Tip 5: Track your own internal growth, not just industry benchmarks. The 0.48%–0.98% engagement benchmark is a useful reference point, but as Tim Eisenhauer of Apaya noted in research cited by NotebookLM: “Your engagement rate this month compared to last month—that tells you everything. That’s the only benchmark worth losing sleep over.” Build a 90-day rolling comparison in your analytics dashboard so you can see directional trends before they become significant problems.
FAQ
Q: Is Instagram still worth investing in if TikTok has higher engagement rates?
Yes—but the decision depends on your commercial objective. TikTok’s 3.70%–4.90% engagement rate per the NotebookLM research is significantly higher than Instagram’s 0.48%–0.98%, but Instagram’s commerce infrastructure is more mature. With 47% of U.S. social buyers expected to shop on Instagram in 2026 and native checkout, product tags, and DM automation all integrated, Instagram converts discovery into purchase more efficiently. For awareness, TikTok wins on raw engagement. For conversion, Instagram’s ecosystem is more complete.
Q: How often should I post to Instagram in 2026?
The optimal cadence is quality over volume, but based on the Hootsuite 2026 data and the NotebookLM research, a sustainable floor is: 4–5 Reels per week, 2–3 carousels per week, and 3–5 Stories per day. Consistency matters more than peak volume—the algorithm rewards accounts that maintain a steady posting rhythm over those that burst-post and go quiet.
Q: Do hashtags still matter in 2026?
Yes, but differently. The Hootsuite report specifies the optimal count at 3–5 niche-specific tags. The bigger opportunity, however, is in keyword-rich captions. Instagram now treats captions as indexable content for both its own search function and Google. A well-optimized caption will drive more discovery than 30 generic hashtags.
Q: How should I handle the decline in organic reach?
The NotebookLM research frames this as the “reach recession”—a structural reality of increased content volume (Reels posting up 35%) outpacing audience attention. Your response should be two-pronged: first, improve content quality to earn algorithmic distribution through Sends and watch-time; second, use paid amplification selectively to extend the reach of your highest-performing organic content. Trying to out-post the algorithm with volume is not a viable strategy.
Q: What’s the most underused Instagram feature for brands in 2026?
Comment-to-DM automation. With 47% of U.S. social buyers ready to transact on the platform and the documented decline in “link in bio” click-through rates, automated DM flows triggered by post comments represent the highest-converting, lowest-friction commerce path available on Instagram right now. Most brands are still using it as a lead capture tool for content downloads—e-commerce brands that use it for direct checkout are seeing significantly compressed purchase funnels.
Bottom Line
Instagram in 2026 is a platform that rewards specificity: specific content topics, specific audience fit, specific format execution. The 3 billion user base and $42.52 billion in projected ad revenue confirm the platform’s scale, but scale only matters if your content earns distribution under the new interest-graph algorithm. Practitioners who realign their metrics—replacing likes with Sends, replacing follower growth with account categorization consistency, and replacing link-in-bio with in-app commerce flows—will outperform the market significantly. The data is clear; the gap between brands that read it and brands that act on it is where the competitive advantage lives in 2026.


0 Comments