

Seven Metrics That Determine Whether Your Business Is Worth Buying
After working through this tutorial, you’ll be able to calculate the seven numbers that separate businesses worth owning from those that merely keep you occupied. Dan Martell — who went from broke at 24 to multi-millionaire at 28 — walks through enterprise value, gross margin, churn rate, lifetime value, customer acquisition cost, conversion rate, and burn rate, each with a formula you can apply today. These aren’t abstract KPIs; they’re the exact inputs buyers use to price your business when you decide to sell.

- Calculate Enterprise Value to orient every decision. Enterprise Value (EV) answers the question every founder should be asking: what would a buyer pay for this today? The formula is Annual Profit × Industry Multiple = EV. A business generating $500K in annual profit with a 3× multiple (typical for agencies) carries a $1.5M enterprise value. Every operational decision — hiring, tooling, pricing — should be evaluated through whether it grows that number.

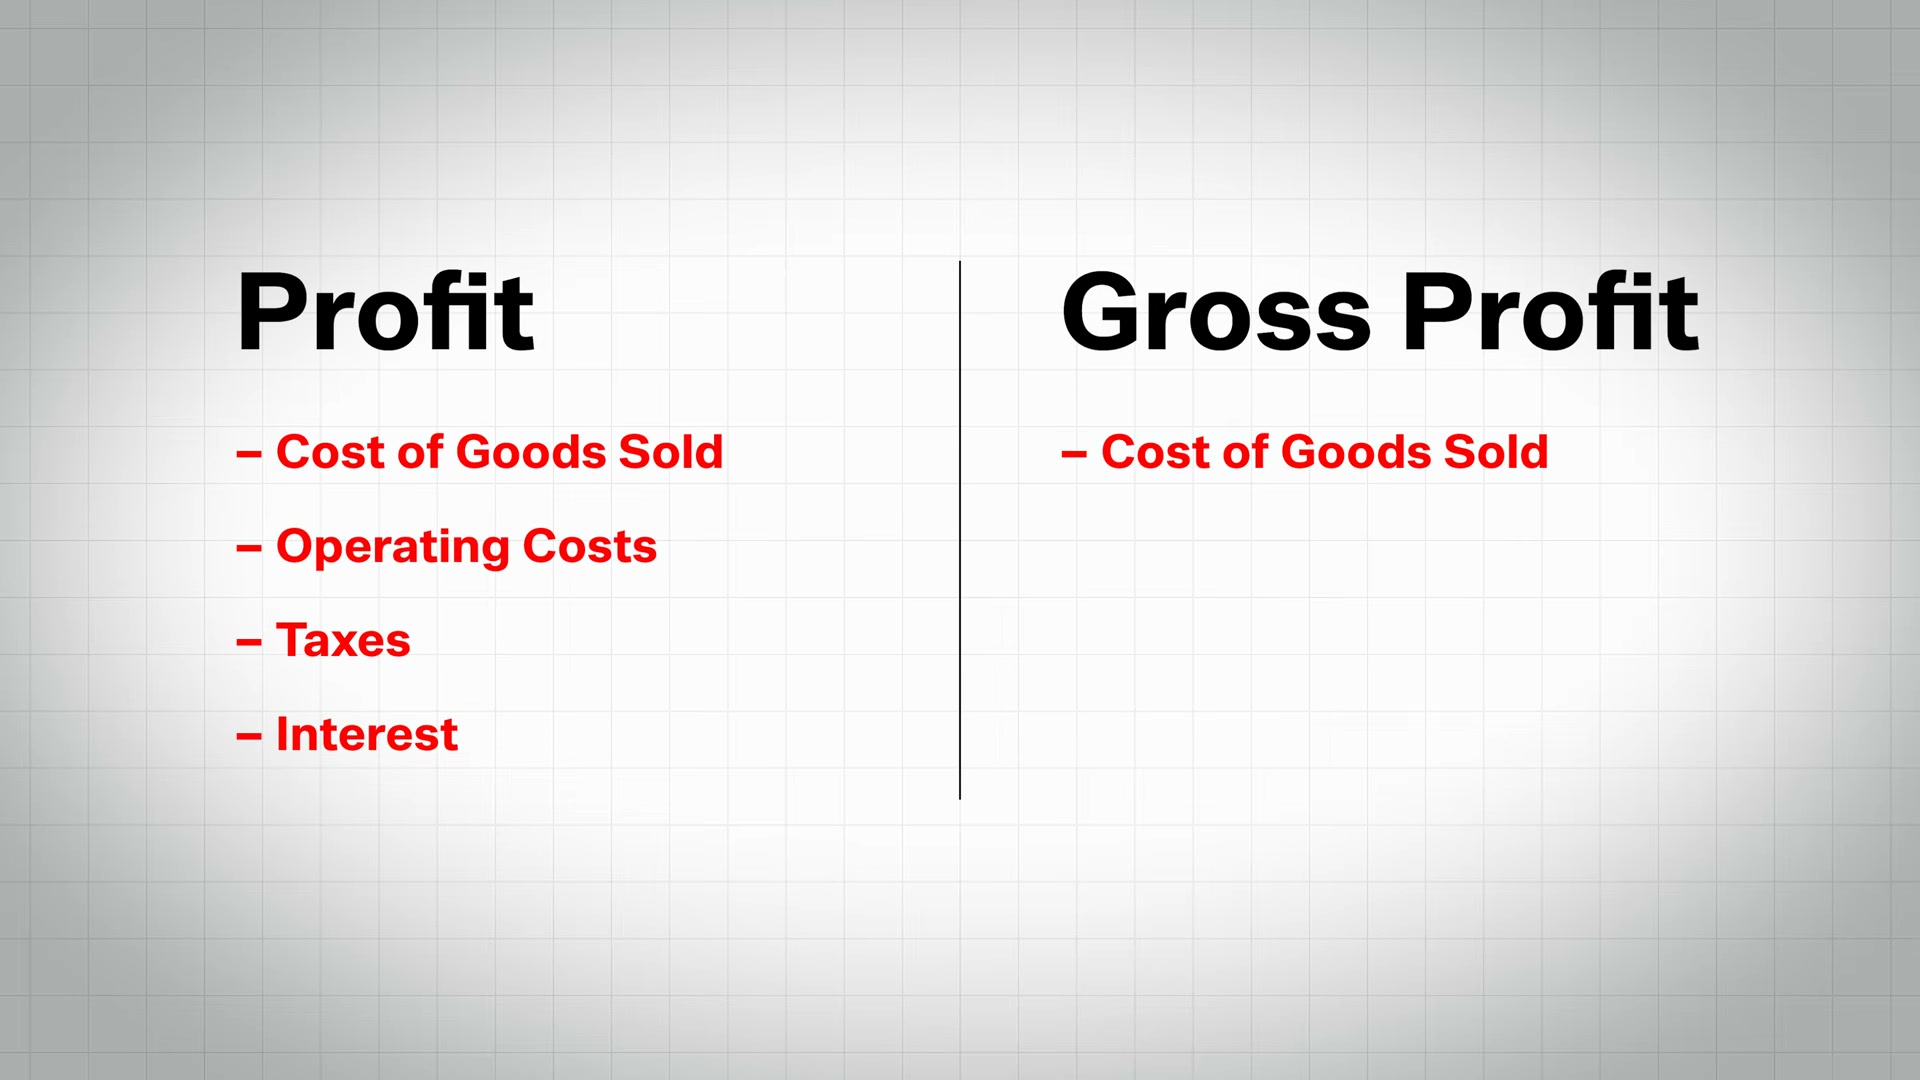
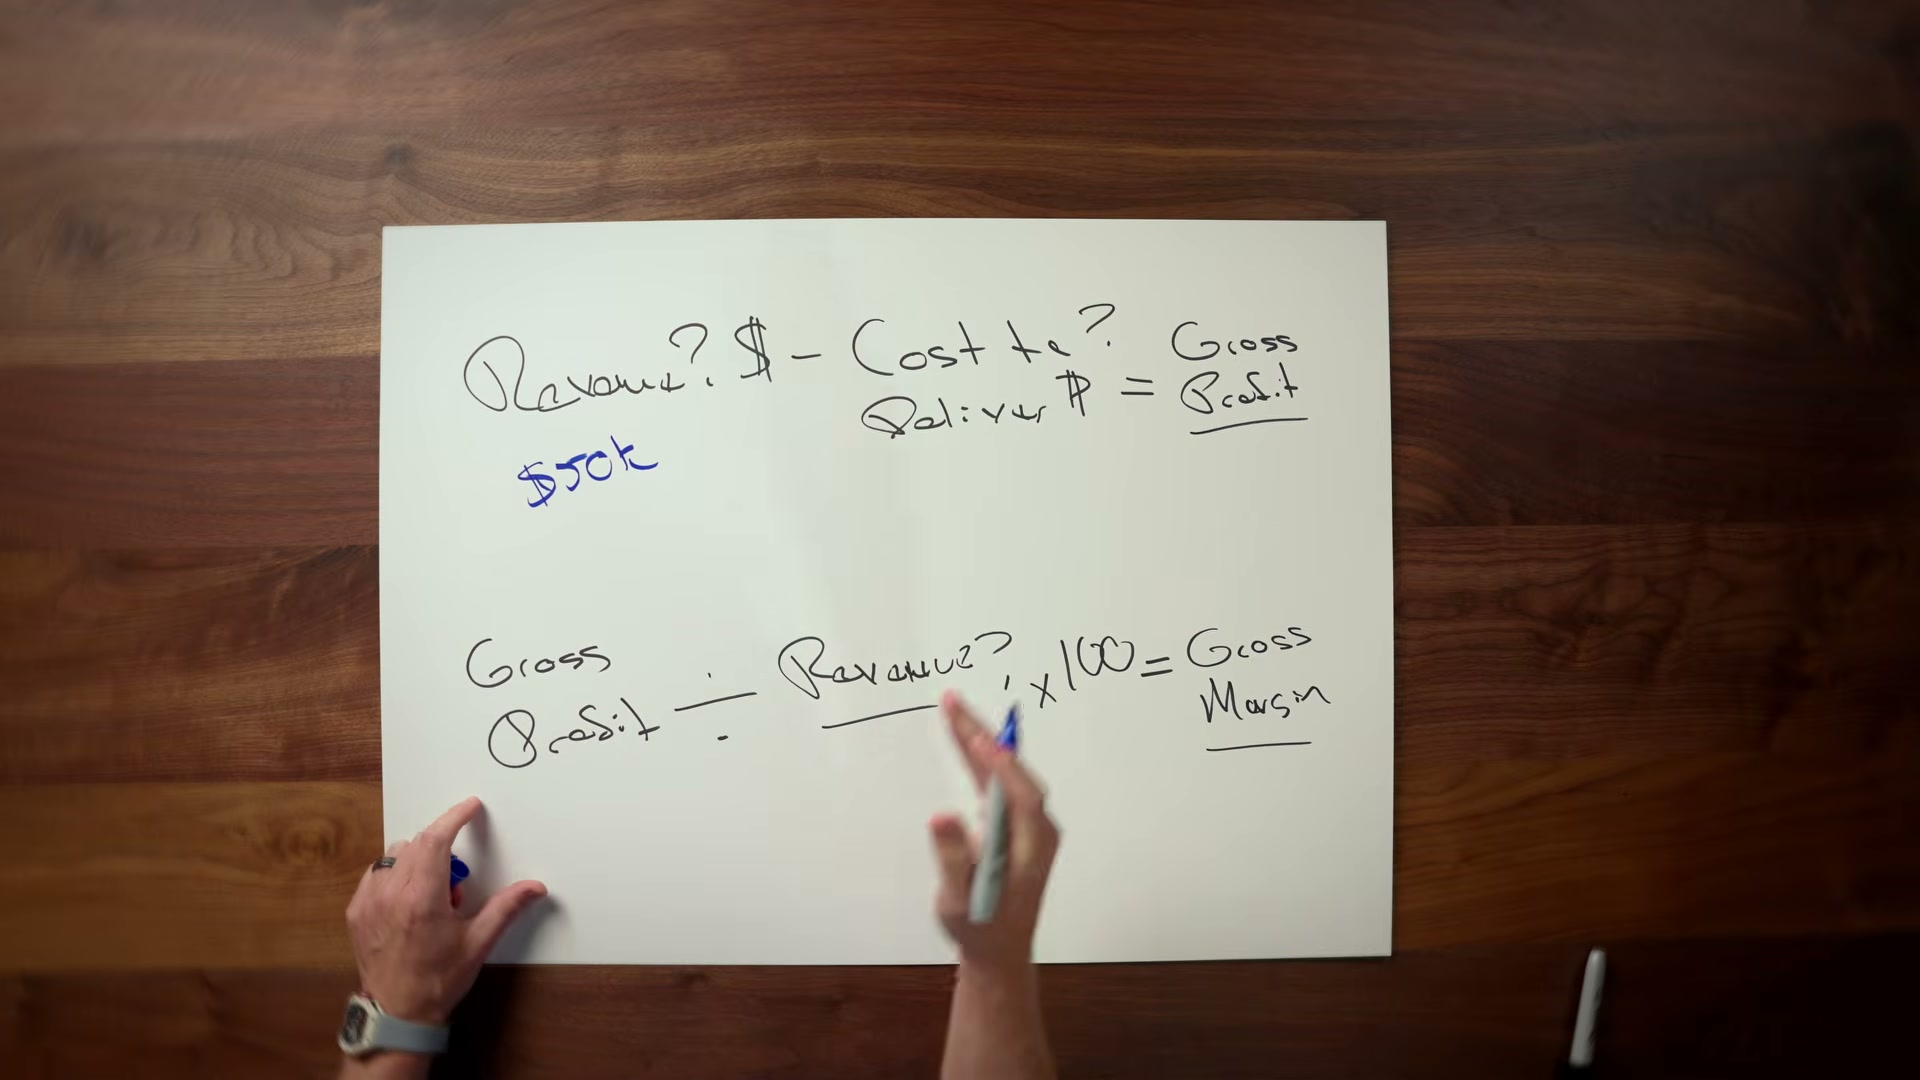
- Calculate Gross Margin and keep it at or above 70%. Gross Margin tells you how efficiently the business converts revenue into profit before overhead. Step one: Revenue − Cost to Deliver = Gross Profit. Step two: (Gross Profit ÷ Revenue) × 100 = Gross Margin %. Using Martell’s numbers: $50K revenue − $10K delivery cost = $40K gross profit; $40K ÷ $50K × 100 = 80% gross margin. His stated floor is 70% — anything below that compresses enterprise value at exit.
- Calculate Monthly Churn Rate before spending on acquisition. Churn Rate = (Clients Lost ÷ Beginning-of-Month Clients) × 100. Lose 3 clients from a starting base of 100 and your monthly churn is 3% — Martell’s benchmark ceiling for agencies. Adding acquisition spend to a leaky business accelerates the loss; retention comes first.

- Calculate LTV and track how churn erodes it. Lifetime Value = Average Monthly Revenue per Client ÷ Monthly Churn Rate. A client paying $100/month at 2% monthly churn (0.02) is worth $5,000. Cut churn in half — without raising prices or adding a single client — and that figure doubles. This mechanism is what drives the exponential enterprise value growth that acquirers are actually purchasing.

-
Calculate CAC and your CAC Payback Period. Customer Acquisition Cost = Total Monthly Acquisition Spend ÷ New Paying Clients. Spend $10,000 acquiring 20 clients and your CAC is $500. The payback period — how many months until that spend is recovered from a client’s monthly revenue — determines how much capital growth actually consumes. A $500 CAC on a $100/month client means you’re financing six months of negative cash before you break even.
-
Map your funnel stage by stage and fix the lowest-converting step. Track conversion at every transition: leads → qualified → booked → showed → closed. Identify the stage with the worst drop-off — that’s where revenue is leaking. Optimizing a single bottleneck compounds across the entire funnel without increasing top-of-funnel spend.
-
Calculate Burn Rate to know your runway. Burn Rate measures monthly cash consumption. Dividing cash on hand by monthly burn gives you runway — the months remaining before the business must reach profitability. The transcript does not deliver the complete formula before cutting off.
Warning: this step may differ from current official documentation — see the verified version below.
How does this compare to the official docs?
Each of these formulas has a canonical definition in financial and SaaS literature, and in several cases the standard methodology carries important nuances that don’t appear on the whiteboard.
Here’s What the Official Docs Show
Dan Martell’s seven-metric framework covers the right terrain — enterprise value, gross margin, churn, LTV, CAC, conversion rate, and burn rate are universally recognized as the core financial health indicators for subscription and service businesses. Act 2 layers in the canonical definitions from SaaS and financial industry literature, giving you the standard formulas to cross-reference against your own implementation.
1. Enterprise Value
No official documentation was found for this step —
proceed using the video’s approach and verify independently.
2. Gross Margin
No official documentation was found for this step —
proceed using the video’s approach and verify independently.
3. Monthly Churn Rate
No official documentation was found for this step —
proceed using the video’s approach and verify independently.
4. Lifetime Value (LTV)
No official documentation was found for this step —
proceed using the video’s approach and verify independently.
5. Customer Acquisition Cost (CAC)
No official documentation was found for this step —
proceed using the video’s approach and verify independently.
6. Conversion Rate / Funnel Analysis
No official documentation was found for this step —
proceed using the video’s approach and verify independently.
7. Burn Rate
No official documentation was found for this step —
proceed using the video’s approach and verify independently.
Useful Links
No documentation sources were captured during the screenshot analysis phase. The following canonical references cover each metric in the standard industry form and are the recommended starting points for independent verification:
- SaaS Metrics 2.0 – A Guide to Measuring and Improving What Matters — David Skok’s comprehensive breakdown of LTV, CAC, churn, and gross margin benchmarks used as the de facto standard across SaaS and subscription businesses.
- Investopedia: Enterprise Value — Standard EV definition, valuation multiple methodology, and how the metric is applied in M&A and business sale contexts.
- Investopedia: Gross Profit Margin — Canonical gross margin formula with industry benchmark guidance and step-by-step calculation walkthrough.
- Investopedia: Customer Acquisition Cost — Standard CAC definition, calculation methodology, and payback period interpretation.
- Investopedia: Burn Rate — Burn rate and cash runway calculation for growth-stage businesses, including the distinction between gross and net burn.


0 Comments