Google Analytics 4 ships without a native “Dashboards” feature — the one tool UA users depended on for daily metric monitoring — but GA4’s reporting architecture gives you three distinct methods to build something more powerful from scratch. This tutorial walks you through all three methods, the five foundational report templates worth customizing, and the configuration decisions that separate genuinely useful dashboards from cluttered noise.
What This Is
Custom dashboards in Google Analytics 4 are manually configured reporting views that consolidate your most critical website metrics into a single, accessible hub. According to the NotebookLM research report based on Semrush’s GA4 dashboard guide, these dashboards serve as “centralized hubs for monitoring essential website metrics, enabling stakeholders to identify performance trends, diagnose issues, and accelerate decision-making processes.”
The shift from Universal Analytics (UA) to GA4 fundamentally changed how reporting works. UA had a dedicated “Dashboards” section — a pre-built area where you could add metric widgets and arrange them into a custom view. GA4 eliminated that feature entirely. This isn’t a product oversight; it reflects Google’s architectural rethink. GA4 is event-based at its core, and the reporting layer was redesigned to match that model. As the research report frames it: “GA4 requires more manual configuration and a deeper understanding of its reporting structure.”
What GA4 provides instead is a set of interconnected components that, properly configured, produce a more flexible and stakeholder-specific reporting environment:
- Reports: Standard, pre-configured views accessible from the left-hand navigation
- Library: A backend management area where you create new reports and organize them into Collections
- Collections: Themed groupings of reports that appear as navigation sections in the left panel
- Explorations: A separate, advanced analysis workspace with its own access point in the navigation
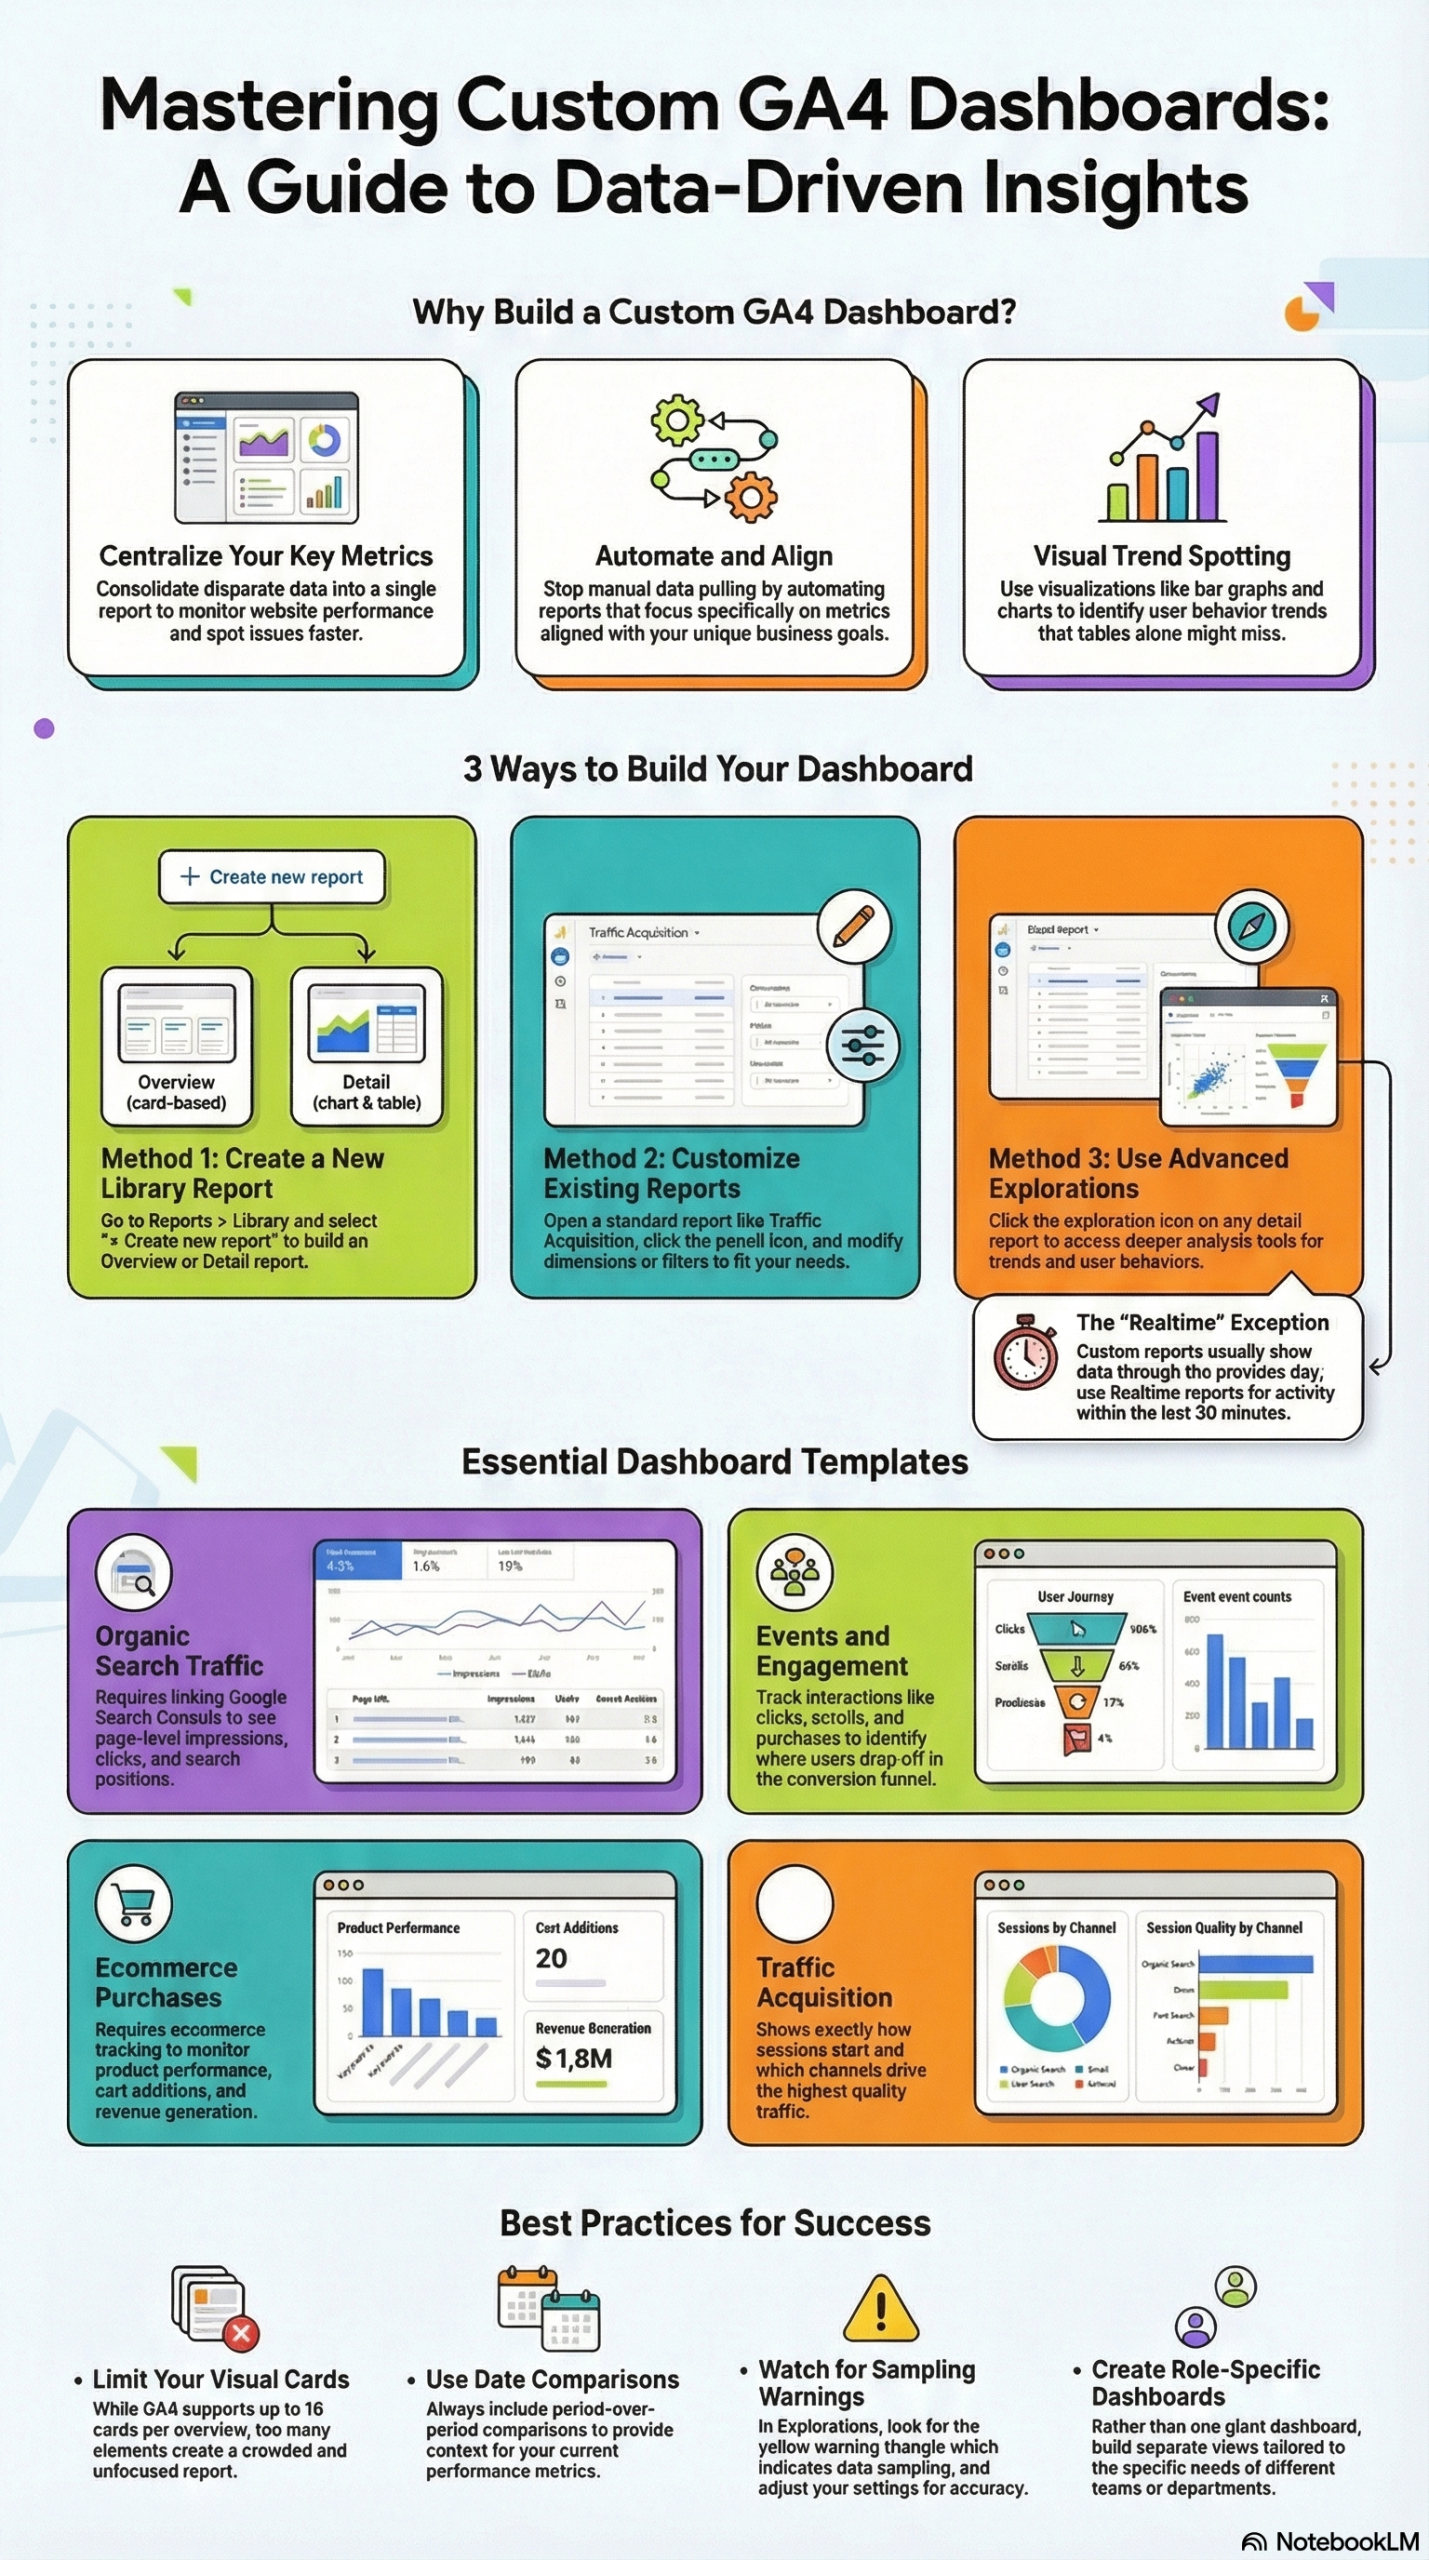
The critical architectural point: GA4 custom dashboards aren’t a single object — they’re an arrangement of reports organized inside Collections. An Overview Report is the closest analog to a traditional dashboard. It displays data cards in a grid layout, each showing a key metric or trend chart, and can hold up to four metrics per card and up to 16 cards per report. A Detail Report is more like a deep-dive page — charts, filterable tables, and dimension-specific breakdowns for detailed analysis of a single topic like traffic channels or landing pages.
Both types live inside Collections, which control what appears in your left-hand navigation. If you create a report in the Library but don’t add it to a Collection, it won’t appear in the navigation — it exists only as a backend object. This is the single most common point of confusion for new GA4 users making the switch from UA.
Explorations operate as a separate system. They’re accessed through a dedicated icon in the GA4 navigation (distinct from “Reports”) and support free-form analysis with variables, multiple visualization types (free-form, funnel, cohort, segment overlap, path exploration), and granular user-behavior data that standard reports don’t expose. The tradeoff, as documented in the research report, is that “explorations are much more prone to sampling than standard reports” — meaning data may be estimated from a subset rather than the full dataset, which has direct implications for accuracy.
Understanding this architecture before building saves significant frustration. The goal isn’t to replicate UA’s dashboard widget system; it’s to build a GA4-native configuration that surfaces the right data for the right teams, at the right level of granularity, with the right navigation structure.
Why It Matters
The core reason to build custom GA4 dashboards isn’t visual aesthetics — it’s decision speed and organizational efficiency. The research report frames the value directly: “Automate reporting rather than manually pulling data each time you log in.” When your dashboard is properly configured, opening GA4 immediately surfaces whether traffic is up or down, which channels are converting, and whether any key metrics have moved outside normal ranges — no manual filter-setting or sub-menu navigation required.
For practitioners managing multiple properties or reporting to stakeholders, this efficiency compounds fast. A single well-configured dashboard can replace 30-45 minutes of manual data pulling per week per property. At agency scale — managing 15-20 client GA4 properties — that’s 7-15 hours per week recovered from reporting grunt work and redirected toward actual analysis.
Beyond individual productivity, custom dashboards create shared organizational infrastructure. GA4 custom reports in a published Collection are visible to every user with property access. This means a properly built Collection becomes a shared reporting layer: the SEO team sees their organic search metrics, the content team sees landing page engagement, and leadership sees revenue and conversions — all without requiring each stakeholder to understand GA4’s report structure or remember where the relevant data lives.
The UA-to-GA4 migration makes this a business-critical task, not an optional optimization. Teams that relied on UA’s built-in dashboards didn’t just lose a UI element — they lost their entire reporting workflow. GA4 has been the default since July 2023 when UA stopped processing new hits. Any organization that hasn’t yet rebuilt their reporting configuration in GA4 is working around the tool rather than through it.
Specific audiences who benefit from custom GA4 dashboards:
- SEO teams: Custom reports combining organic search traffic (via Google Search Console integration) with on-site engagement metrics like avg. engagement time and conversions from organic sessions
- Content teams: Landing page reports filtered by URL pattern, showing which content drives engagement, scrolls, and conversion events
- Ecommerce teams: Purchase funnel dashboards surfacing add-to-cart rates, checkout abandonment, and revenue by product category
- Executives and leadership: High-level overview reports focused exclusively on revenue, goal completions, and traffic trends — stripped of operational noise
- Agencies: Role-specific, client-facing report Collections tailored to each client’s KPIs, organized for consistent monthly reporting across a portfolio
The Semrush source article additionally notes that GA4 data can be integrated into external platforms like the Semrush One SEO Dashboard for organizations wanting to combine GA4 metrics with search visibility data and AI brand monitoring — particularly relevant for teams tracking how large language models like ChatGPT and Gemini reference or describe a brand.
The Data: GA4 Report Types and Foundational Templates
The five foundational report templates the research report identifies as the most effective starting points for custom dashboards break down along clear use-case lines:
| Report Type | Key Metrics | External Integration Required? | Primary Use Case |
|---|---|---|---|
| Organic Search Traffic | Impressions, clicks, CTR, avg. position | Yes — Google Search Console link | SEO performance monitoring |
| Traffic Acquisition | Sessions, channel breakdown, conversions | No | Multi-channel attribution comparison |
| Events | Event count by type (clicks, scrolls, purchases) | No | UX optimization, engagement analysis |
| Ecommerce Purchases | Revenue, product sales, add-to-cart rate | Yes — ecommerce tracking implementation | Revenue tracking, purchase funnel |
| Landing Page | Sessions, engagement rate, conversions by entry page | No | Content performance, CRO analysis |
GA4 Dashboard Construction Methods Compared:
| Method | Access Path | Best For | Data Sampling Risk |
|---|---|---|---|
| New Overview Report | Reports > Library > Create new report | High-level KPI dashboards, executive views | None |
| New Detail Report | Reports > Library > Create new report | Granular single-dimension analysis | None |
| Customize Existing Report | Open any report > Pencil icon | Adapting standard reports to specific needs | None |
| Explorations | Explore icon in left navigation | Advanced funnel, cohort, path analysis | High — monitor for yellow warning triangle |
Both tables are derived from the NotebookLM research report and the Semrush GA4 dashboard guide.
Step-by-Step Tutorial: Building GA4 Custom Dashboards
Prerequisites
Before building anything, verify the following:
- You have Editor or Administrator role on the GA4 property. Viewer access won’t allow you to save reports, modify the Library, or create Collections. Check under Admin > Property access management.
- Your GA4 property has been collecting data for at least a few days. New properties with no data history make configuration validation impossible.
- If you plan to use the Organic Search Traffic report, Google Search Console is already linked to your GA4 property. Set this up first: Admin > Property settings > Search Console Links > Add link.
- If you plan to use ecommerce reports, ecommerce event tracking is implemented and actively sending purchase events (verify in the Events report under Reports > Engagement > Events).
Phase 1: Access the GA4 Library
The Library is GA4’s report management backend — where you create, edit, and organize all custom reports. Most users never see it because it’s not prominently surfaced in the default navigation.
- Log into Google Analytics and select your property from the account/property selector.
- In the left-hand navigation, click Reports (the bar chart icon — second icon from the top).
- Scroll to the very bottom of the Reports navigation panel. You’ll see a Library link. Click it.
- If you don’t see Library in the navigation, your account role is Viewer only — you won’t be able to create or modify reports until your access is upgraded.
The Library displays two panels:
– Reports (top section): All existing reports — both GA4 defaults and any custom reports you’ve created
– Collections (bottom section): The groupings that appear as navigation sections in the left panel
This is the hub for all configuration work you’ll do.
Phase 2: Create a New Overview Report
Overview Reports are the GA4 equivalent of a traditional dashboard — a card-based grid layout showing your top KPIs at a glance.
- In the Library, click Create new report.
- From the options that appear, choose Create overview report.
- The report editor opens with a blank canvas. At the top of the editor, click the report title and rename it to something descriptive and audience-specific — for example: “Executive KPI Dashboard” or “SEO Weekly Overview.”
- Click Add cards to add metric cards to the report grid. Each card can display:
- A single metric with its current period value (e.g., Total Users: 48,230)
- A sparkline or line chart showing the metric’s trend over the selected date range
- A comparison table showing a dimension broken out by a metric (e.g., top traffic channels by sessions)
- Add the cards most relevant to the report’s intended audience. For an executive-facing dashboard, consider: Total Users, Sessions, Conversions (goal completions), Revenue (if tracked), Top Channels table, and a Bounce Rate / Engagement Rate trend.
- You can add up to 16 cards per overview report. The research report notes a practical constraint worth heeding: “a focused report is generally more effective than a crowded one.” Limit your first version to 6-10 well-chosen cards.
- Rearrange cards by dragging them into your preferred grid order.
- Click Save in the top-right corner.
The report is now saved in your Library — but it won’t appear in your navigation yet. You must add it to a Collection (Phase 4) for it to be accessible from the main nav.
Phase 3: Customize an Existing Report
This method is the fastest path when a standard GA4 report is already close to what you need, requiring only dimension, metric, or filter adjustments.
- Navigate to any existing standard report. For this example, go to: Reports > Acquisition > Traffic Acquisition.
- In the top-right corner of the report, click the pencil icon (labeled “Customize report” on hover). This opens the customization sidebar on the right side of the screen.
- In the customization sidebar, you can modify:
- Report name: Rename it for clarity (e.g., rename “Traffic Acquisition” to “Channel Performance — All Sources”)
- Metrics: Click the pencil icon next to “Metrics” to add or remove metrics from the summary table. Add “Conversions” or “Revenue” if your goal is outcome-focused reporting; remove engagement metrics you don’t actively use
- Dimensions: Change the primary dimension in the breakdown table — switch from “Session default channel group” to “Session source / medium” for more granular attribution
- Charts: Toggle between chart visualization types (line, bar, or scatter) depending on what best communicates the data
- Filters: Add persistent filters that apply every time the report loads. For example, add a filter for “Session default channel group = Organic Search” to create an organic-only version of the report. The Semrush source specifically calls out using this approach to filter for AI-referral traffic as that channel grows in significance
- Click Apply in the sidebar to preview the changes on the report.
- Click Save in the top-right and choose:
- Save changes to current report — overwrites the existing report with your customizations
- Save as a new report — preserves the original and creates a new custom version (recommended if others rely on the standard report)
Phase 4: Add Reports to a Collection and Publish
This is the step most users skip — and why their custom reports seem to disappear. Until a report is in a published Collection, it exists only in the Library backend, invisible from the main navigation.
- Go back to the Library.
- In the Collections section, decide whether you’re adding your report to an existing Collection or creating a new one:
- Existing Collection: Click the three-dot menu on the Collection card > Edit collection
- New Collection: Click Create new collection, name it (e.g., “SEO Team Reports” or “Marketing Leadership”), and click Create
- In the collection editor, you’ll see a list of available reports on the left panel. Find your custom report(s) in this list.
- On the right panel, you’ll see Topics — sub-sections within the Collection that appear as collapsible menu items in the navigation. Either drag your report into an existing topic or click Add topic to create a new grouping.
- Drag your custom report from the left panel into the appropriate topic on the right.
- Click Save in the top-right of the collection editor.
- Back in the Library, find your Collection card. If it shows an Unpublished badge, click the three-dot menu > Publish. If it was already published, saving the edit automatically updates the live navigation.
Your custom report is now accessible in the left-hand navigation under the Collection’s section name.
Phase 5: Build an Exploration for Advanced Analysis
Explorations are for analytical questions that standard reports can’t answer: funnel drop-off analysis, cohort retention, multi-step path analysis, or any query requiring complex dimension/metric combinations.
- In the left navigation, click the Explore icon (compass icon, positioned below the Reports icon).
- Click Blank to start from scratch, or select a template:
- Funnel Exploration: Visualize step-by-step drop-off through a defined sequence of events
- Cohort Exploration: Track how user cohorts (grouped by acquisition date) retain over time
- Segment Overlap: Compare up to three user segments to identify behavioral overlap
- Path Exploration: Visualize user navigation paths forward or backward from any event
- In the Exploration editor, work across three panels:
- Variables (left): Set your date range; define Segments, Dimensions, and Metrics you want to work with by clicking the + button next to each category
- Settings (center tab): Configure what populates rows, columns, and values in the visualization — drag items from Variables into these slots
- Visualization (right): Live output that updates as you configure the Settings panel
- To build a funnel exploration: in Settings, click Add step for each event in your funnel sequence (e.g., view_item → add_to_cart → begin_checkout → purchase). GA4 calculates completion rate and drop-off at each step automatically.
- To share your exploration: click Share exploration (top-right icon). Explorations are user-specific by default — unlike standard reports, they must be explicitly shared with collaborators.
Critical note on sampling: The research report explicitly warns that “explorations are much more prone to sampling than standard reports.” If you see a yellow warning triangle in the top-right of your exploration, the data is sampled — estimated from a subset of sessions rather than the full dataset. For revenue reporting or conversion analysis used in budget decisions, cross-validate any sampled exploration figure against the equivalent standard report.
Expected Outcomes
After completing all five phases, you will have:
- At least one custom Overview Report surfacing your top KPIs in a card-based layout
- At least one customized standard report aligned to your team’s specific dimensions, metrics, and filters
- All reports organized into Collections and visible in the left-hand navigation for the entire team
- At least one Exploration configured for advanced analytical use cases
One important limitation to communicate to stakeholders before launch: data in standard custom reports updates through the previous full day, not in real-time. For live traffic (last 30 minutes), direct stakeholders to Reports > Realtime. This is a documented behavior in both the source article and the research report, and setting this expectation upfront prevents confusion.
Real-World Use Cases
Use Case 1: SaaS Company — Executive Weekly Dashboard
Scenario: A B2B SaaS marketing team needs to brief the CEO every Monday morning on website performance. The CEO doesn’t navigate GA4 directly and needs one view showing traffic trends, lead conversions, and top acquisition channels — nothing else.
Implementation: Build a new Overview Report with 6 focused cards: Total Users (line trend), Sessions (line trend), Goal Completions / Conversions, Revenue from trials or demo requests (if tracked via ecommerce events), a Top Channels table (channel group vs. sessions), and Engagement Rate trend. Add this report to a “Leadership” Collection with a clear name. Publish it. Grant the CEO Viewer access to the property — they’ll see only the Collections you’ve configured.
Expected Outcome: The CEO opens GA4, sees the “Leadership” section in the left nav, opens the report, and reads the weekly snapshot in under 60 seconds. No GA4 navigation training required. The team spends zero time building a weekly PowerPoint from manual data exports.
Use Case 2: Digital Agency — Scalable Client SEO Reporting
Scenario: An SEO agency manages 15 client GA4 properties. Each client wants a consistent monthly report showing organic search performance, top-performing landing pages, and organic conversion rates.
Implementation: For each property, (1) link Google Search Console and add the Organic Search Traffic report to the client’s Collection; (2) customize the Traffic Acquisition report with a persistent filter for “Session default channel group = Organic Search” and add a Conversions metric column; (3) customize the Landing Page report with the same organic filter to show top entry pages by organic traffic. Group all three into an “SEO Performance” Collection per property and publish. Document the configuration steps once, then replicate across all 15 properties.
Expected Outcome: Consistent reporting infrastructure across the entire client portfolio. Monthly reporting becomes: open GA4 > navigate to SEO Performance > set date range comparison (current month vs. prior month) > export or screenshot. No manual data aggregation. Replication across new client properties takes under 20 minutes per property once the configuration template is documented.
Use Case 3: Ecommerce Brand — Purchase Funnel Drop-Off Analysis
Scenario: An ecommerce brand has a 68% add-to-cart abandonment rate and needs to identify whether the drop-off is concentrated at the checkout initiation step, the payment step, or split evenly across devices.
Implementation: Build a Funnel Exploration with four steps: (1) view_item event, (2) add_to_cart event, (3) begin_checkout event, (4) purchase event. Set the date range to the last 30 days for statistical significance. Add a Segment breakdown by device category (mobile, desktop, tablet) using the Variables panel to identify device-specific drop-off patterns.
Expected Outcome: A funnel visualization showing percentage completion and drop-off at each step, segmented by device. If mobile checkout initiation → purchase drop-off is 35% higher than desktop, that’s a direct prioritization signal for mobile checkout UX investment — a finding that standard reports can surface in aggregate but not at this funnel-step granularity.
Use Case 4: Content Team — Blog Performance Dashboard
Scenario: A content team publishing 15 articles per month needs to track which articles drive email signup conversions (a GA4 custom event) and identify articles with high scroll depth but low conversion — pieces attracting readers who don’t take action.
Implementation: Customize the Landing Page report to include: Sessions, Avg. Engagement Time, a scroll event metric column (tracking users who scroll 90% depth), and Conversions. Apply a URL filter matching the blog path pattern (e.g., /blog/). Sort by Sessions descending to rank articles by traffic volume. Save as a new report (“Blog Content Performance”) in a “Content Team” Collection.
Expected Outcome: A ranked article table showing traffic, engagement depth, and conversion side by side. The research report specifically identifies the value of detecting “high scroll but low conversion” patterns through Events data — articles where users clearly read the content but don’t take the desired next action, signaling a weak CTA or poor content-to-offer alignment.
Use Case 5: Multi-Brand Enterprise — Consolidated Channel Reporting
Scenario: An enterprise marketing team manages three brands under one GA4 property (or three separate properties) and needs to compare channel performance across brands for quarterly business reviews.
Implementation: For a single property with multiple brand sub-domains, customize the Traffic Acquisition report with a hostname dimension filter per brand. Create three separate Detail Reports, each filtered to a specific hostname (brand1.com, brand2.com, brand3.com), with identical metric columns (Sessions, Conversions, Revenue, Engagement Rate) for direct comparability. Group them into a “Brand Comparison” Collection. For separate properties, use a Looker Studio connector to pull all three GA4 properties into a single cross-property view.
Expected Outcome: Brand-level channel performance visible in a standardized, comparable format — enabling QBR analysis without exporting data to spreadsheets or relying on a BI analyst to compile reports manually.
Common Pitfalls
Pitfall 1: Creating Reports Without Publishing a Collection
The most common configuration mistake. You build and save a report in the Library, return to the main navigation, and can’t find it. Reports that aren’t assigned to a published Collection are invisible from the navigation — accessible only by someone navigating directly to the Library backend. The fix: always complete Phase 4 immediately after creating or saving a custom report. Create the Collection, add the report, publish. Don’t skip it.
Pitfall 2: Using Too Many Cards in Overview Reports
GA4 allows 16 cards per Overview Report. Teams routinely fill all 16 and produce a dashboard where nothing stands out because everything is equally prominent. The research report is direct on this: “a focused report is generally more effective than a crowded one.” Start with 6 cards, validate that stakeholders reference each one in actual reporting conversations, and add only when there’s demonstrated need. More metrics is not more signal — it’s more noise.
Pitfall 3: Missing Sampling Warnings in Explorations
Explorations display a yellow warning triangle when data is sampled. It’s easy to miss in the top-right corner of a visualization, especially when you’re focused on the numbers themselves. The research report explicitly warns about this: “Explorations are much more prone to sampling than standard reports.” Sampled exploration data can deviate 10-20% from actual figures. For any metric used in budget allocation, forecasting, or leadership reporting, cross-validate against the equivalent standard report.
Pitfall 4: Looking at Metrics Without Period-Over-Period Comparisons
“12,500 sessions this week” is nearly meaningless in isolation. Without context — is this up or down from last week? from the same week last year? — there’s no trend signal. GA4’s date comparison feature (click the date range selector, enable “Compare to”) adds a prior-period delta column to every report. The research report lists period-over-period comparison as a core best practice. Not enabling it is the analytics equivalent of reading a P&L without the prior year column.
Pitfall 5: Building One Dashboard for Every Stakeholder
A single “universal” dashboard that tries to serve the SEO team, content team, and executive leadership simultaneously serves none of them well. Every audience has different KPIs, different context, and different data literacy. The research report recommends building role-specific versions — a separate Collection for each team. The upfront time cost of building three focused Collections rather than one bloated one pays back immediately in reduced “where’s my data?” questions and stakeholder confusion.
Expert Tips
1. Build Filters to Create Channel-Specific Report Variants
Rather than one Traffic Acquisition report, build three parallel versions filtered by channel: Organic Search, Paid Search, and Email/Direct. Each becomes a dedicated channel performance view. Channel owners stay in their lane and see only the data relevant to their work — no need to apply manual filters each session.
2. Name Every Report With Its Audience and Scope in the Title
“Traffic Acquisition — Organic Search Only (SEO Team)” is dramatically more useful as a report name than “Custom Report 3.” When a GA4 property has multiple users from multiple teams, ambiguous report names create redundant configurations and version confusion. Establish a naming convention before you start building: [Topic] — [Filter Scope] ([Intended Audience]).
3. Separate Real-Time Monitoring From Dashboard Monitoring
Custom dashboards display data through the previous full day — confirmed in both the source article and the research report. For campaign launches, product drops, or live events, bookmark GA4’s Realtime overview (Reports > Realtime) as a separate browser tab. Using a day-lag dashboard to monitor a live campaign produces dangerously delayed signals.
4. Link Google Search Console Before Building Any SEO Reports
The Organic Search Traffic report — one of the five foundational templates identified in the research report — is empty without a live GSC integration. It won’t show impressions, clicks, CTR, or position data. If you build the SEO Collection first and link GSC second, you’ll spend time troubleshooting an empty report. Reverse the order: Admin > Property settings > Search Console Links > Add link, confirm data is flowing, then build the reports.
5. Document Exploration Configurations for Cross-Property Replication
GA4 Explorations can’t be templated or applied to multiple properties natively — each property requires a manual rebuild. The workaround is to document each exploration configuration in a shared specification: date range, segments used, dimensions, metrics, funnel steps, visualization type. Store these specs alongside your Collection configuration docs. When onboarding a new property, you can recreate a consistent exploration setup in 10-15 minutes from a documented spec rather than rebuilding from memory.
FAQ
Q: Does GA4 have a built-in “Dashboards” section like Universal Analytics?
No. As documented in the research report and confirmed by the Semrush source article, “Google Analytics 4 doesn’t have the same built-in ‘Dashboards’ feature that existed in Universal Analytics.” The equivalent is built manually through custom reports, Overview Reports, and Collections — requiring deliberate configuration rather than out-of-the-box availability.
Q: Who can see my custom reports once I save them?
Anyone with access to the GA4 property can see custom reports in a published Collection — they don’t need to be the person who created them. Reports that exist only in the Library (not yet added to a Collection) are only visible to users who navigate to the Library directly, which requires at minimum an Editor role. To share dashboards with Viewers, publish the Collection.
Q: How often does data in custom reports refresh?
Standard custom reports in GA4 display data through the previous full day — not in real-time. This is a documented limitation in both the Semrush guide and the research report. For live traffic data from the last 30 minutes, use Reports > Realtime, which operates separately from the custom report system and does provide near-real-time data.
Q: When should I use Explorations vs. standard custom reports?
Use standard custom reports (Overview or Detail) for recurring, day-to-day monitoring — metrics your team reviews regularly. Use Explorations for one-off analytical questions: funnel drop-off, cohort analysis, multi-step path analysis, or complex cross-dimensional queries that standard reports can’t produce. The critical tradeoff, per the research report, is that explorations carry materially higher sampling risk, making them less reliable for high-stakes financial or conversion reporting.
Q: Do I need to rebuild dashboards for every GA4 property I manage?
Yes. Report configurations, Collections, and Explorations are property-specific in GA4 — there’s no cross-property template system. For agencies managing multiple properties, the practical approach is to document each configuration as a reproducible spec (report name, dimensions, metrics, filters, Collection structure) and systematically apply it when onboarding each new property. Alternatively, tools like Looker Studio can pull data from multiple GA4 properties into a single external dashboard, bypassing the need for identical per-property configurations.
Bottom Line
GA4’s dashboard architecture is ultimately more flexible than UA’s widget system, but it requires deliberate, structured setup that UA users didn’t need to think about. The three construction methods — new reports, customized existing reports, and explorations — serve different analytical needs at different depth levels, and the Collection/Library system is what controls day-to-day accessibility for your team. Build role-specific Collections rather than one universal view, keep Overview Reports focused on 6-10 critical metrics, and treat Explorations as your analytical workbench rather than your operational monitoring layer. Organizations that build GA4 dashboards correctly stop losing hours to manual data extraction and start making faster decisions from a consistent, shared data foundation — the exact outcome the shift to GA4 was designed to enable.


0 Comments