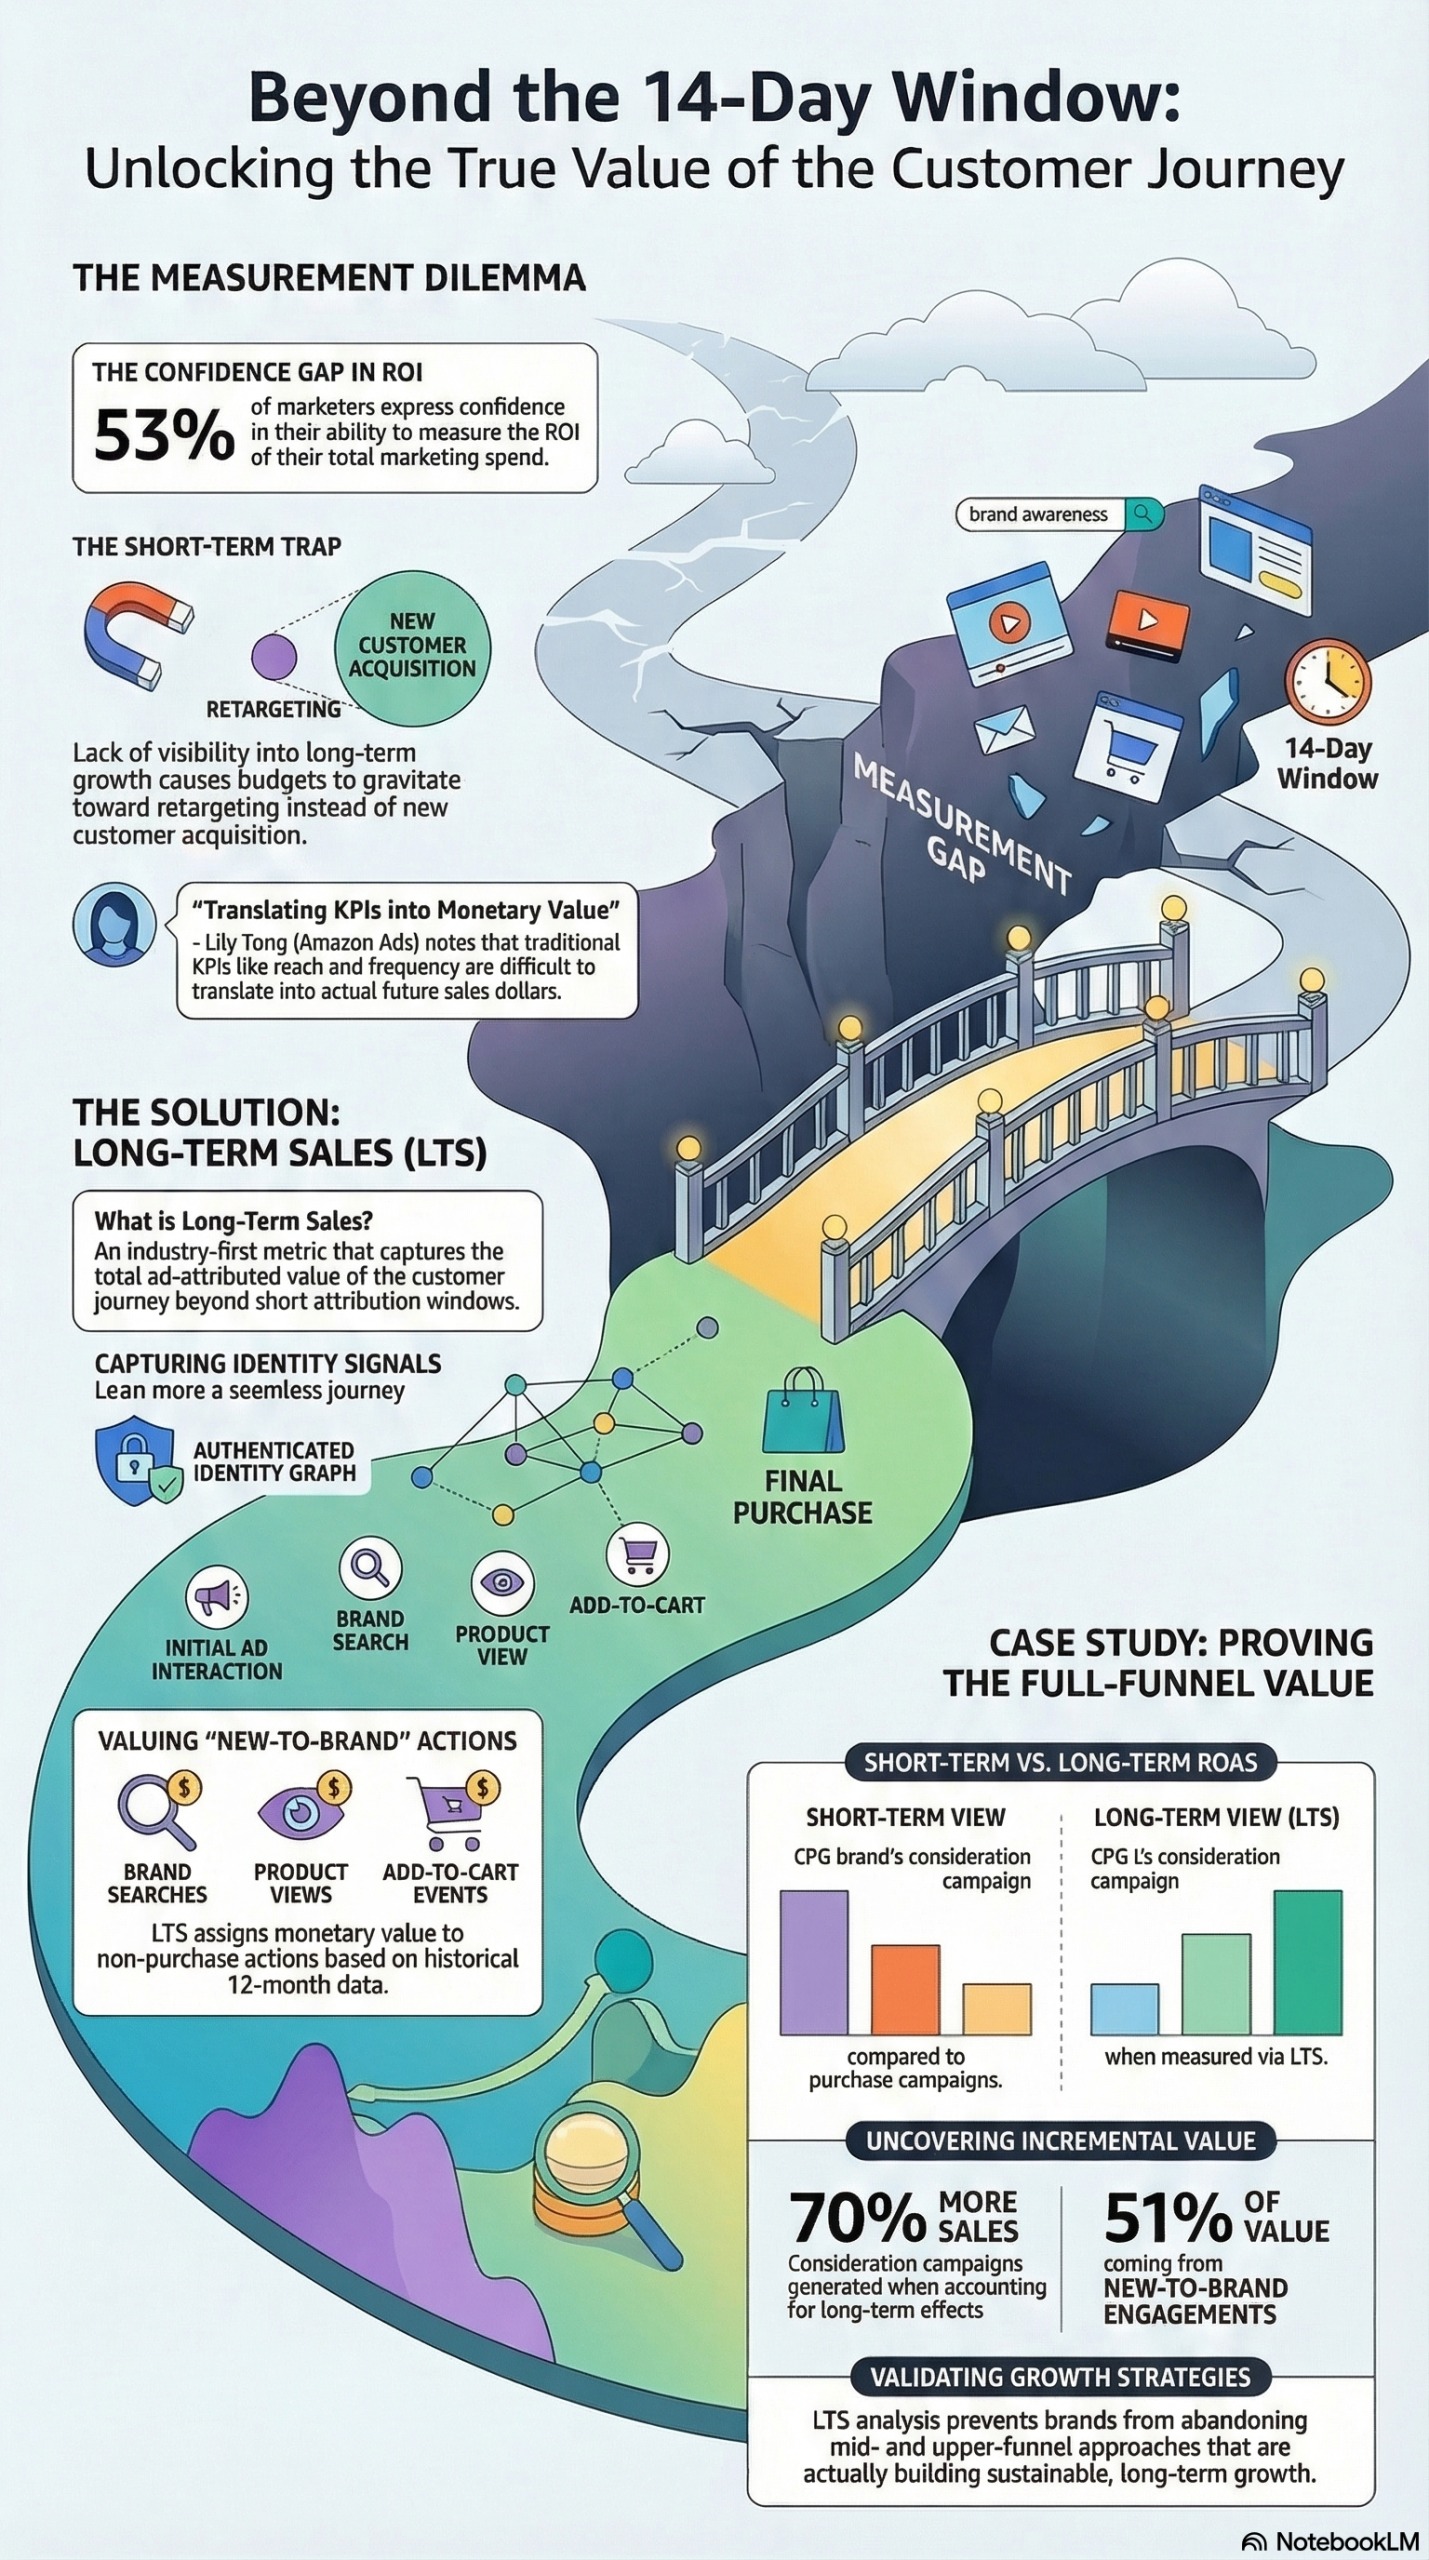
Only 53% of marketing leaders are confident they can accurately measure the ROI of their total marketing spend — and that lack of confidence is quietly draining billions of dollars from upper-funnel budgets every year. A new industry metric called Long-Term Sales (LTS) was built specifically to close this gap, assigning a hard dollar value to awareness and consideration campaigns that traditional attribution windows miss entirely. This tutorial walks you through what LTS is, how it works mechanically, and exactly how to implement it inside your measurement stack.
What Is Long-Term Sales (LTS) Measurement?
Long-Term Sales (LTS) is an industry-first advertising measurement metric developed by Amazon Ads to assign monetary value to mid- and upper-funnel customer engagements — not just to the final click before purchase. According to the NotebookLM research report compiled from the Digiday source, LTS operates on a fundamentally different architecture than pixel-based last-click or even multi-touch attribution models.
The core distinction: LTS does not simply extend an attribution window. It changes the type of signals being measured.
Traditional pixel-based attribution tracks one thing: did a purchase happen within X days of an ad exposure? LTS tracks a broader set of behavioral signals — brand searches, product page views, add-to-cart events, and new-to-brand interactions — and then maps those signals backward to ad exposures using an authenticated identity graph. The identity graph connects a shopper’s behavior across sessions, devices, and time using persistent (authenticated) identifiers rather than cookies or probabilistic fingerprinting.
The data foundation for LTS includes two key inputs:
- An authenticated identity graph — tracks shoppers from ad interaction through the full Amazon shopping journey, linking identities across touchpoints with high fidelity.
- 12 months of historical shopper signals — the model analyzes a brand’s own historical data to determine which pre-purchase behaviors (searches, views, add-to-carts) are leading indicators of future purchases for that specific brand.
The result is a valuation model that can look at a shopper who saw a Connected TV (CTV) ad, ran a brand search three weeks later, and viewed two product pages before purchasing in month two — and assign a dollar value to that CTV impression, even though it happened long before the purchase event.
The validation layer is equally important. Brands can cross-reference LTS findings with historical data inside Amazon Marketing Cloud (AMC) — Amazon’s privacy-safe data clean room — to verify that the model’s predictions align with actual past purchase behavior. This isn’t a black box; it’s a methodology that can be audited against ground truth.
To understand why this matters operationally, consider how consideration campaigns are typically evaluated. A campaign targeting new category shoppers — people who have never bought your product category before — will, by design, attract people at an early stage of their decision-making process. Their purchase might come 45, 60, or 90 days after first exposure. Measured against a standard 14-day attribution window, that campaign looks like it failed. Measured with LTS, it looks like what it actually is: a new customer acquisition engine with a longer payback period.
As Lily Tong, Director of Brand and Cross-Channel Measurement at Amazon Ads, explained: “Shopping journeys, especially on Amazon, are highly non-linear. With long-term sales, you can see which new-to-brand interactions drive future sales growth — something brand managers intuitively understand is important but now can quantify.”
Why It Matters for Practitioners and Marketers
The measurement gap between brand investment and provable business outcome isn’t a new problem — but LTS represents the first time the industry has a scalable, dollar-denominated solution for it.
Here’s why this is operationally significant right now.
The budget allocation distortion is real. According to Boston Consulting Group data cited in the research report, 46% of B2C marketing leaders are actively struggling to balance short-term revenue generation against long-term growth. That struggle almost always resolves in the same direction: money flows to retargeting and lower-funnel tactics because they produce attributable ROAS. Upper-funnel campaigns — CTV, online video, display, podcast — get squeezed because their returns are invisible under standard measurement.
The problem with that cycle is structural. Retargeting captures existing intent; it doesn’t create new demand. A brand that over-indexes on retargeting at the expense of awareness campaigns will eventually exhaust its addressable audience. The pipeline stops refilling. Growth plateaus or reverses. The short-term ROAS numbers look fine right up until they don’t.
LTS makes the business case for the full funnel in CFO language. When you can walk into a budget review and show a CMO or CFO that a Q3 consideration campaign generated a 1.7x higher ROAS than your standard measurement indicated — with the methodology validated against historical purchase data — you change the conversation entirely. Brand investment stops being a “faith-based” line item and becomes a quantifiable growth lever.
This matters most for three specific audience segments:
- CPG brands with long purchase cycles and significant new-category acquisition goals. The case study documented in the research report is directly from this segment.
- Retail and e-commerce brands selling on Amazon, where the authenticated identity graph has the richest signal density.
- Agencies managing full-funnel campaigns who need to justify upper-funnel line items in client reports without resorting to reach and frequency metrics alone.
What makes LTS different from extended attribution windows? Standard extended windows (30-day, 60-day) still only count purchases. LTS counts the steps toward a purchase and assigns them monetary value based on the statistical likelihood they lead to a sale, calibrated to each brand’s specific historical data. It’s the difference between measuring a marathon by the finish line alone versus by every mile marker.
The Data: Short-Term vs. Long-Term Measurement Results
The most compelling evidence for LTS comes from an actual CPG brand case study documented in the NotebookLM research report. Here’s what the numbers showed when the same consideration campaigns were evaluated under standard attribution versus LTS:
| Measurement Dimension | Standard Attribution (14-day) | Long-Term Sales (LTS) | Difference |
|---|---|---|---|
| ROAS vs. Purchase Campaigns | 34% lower | 70% higher total sales | +104% swing |
| New-to-Brand Contribution | Not measured | 51% of incremental value | Newly visible |
| True ROAS (incl. future sales) | Baseline | 1.7x higher | +70% |
| Attribution Window | 14 days | Multi-month journey | Substantially longer |
| Signal Types Counted | Purchase events only | Searches, views, add-to-cart, purchases | 4x+ richer |
| Identity Resolution | Cookie/pixel-based | Authenticated identity graph | Higher fidelity |
Source: Digiday / Amazon Ads — “How brands are measuring value across the entire customer journey”
The 34% short-term ROAS gap between consideration and purchase campaigns is exactly the kind of data point that gets consideration budgets cut in quarterly reviews. The LTS analysis flips that narrative: the same campaigns that looked underperforming actually drove 70% more total sales when the full purchase journey was measured. That is a measurement artifact causing real capital misallocation — not a campaign performance problem.
The 51% new-to-brand contribution figure is equally important. More than half of the long-term value generated came from customers who were completely new to the brand. That’s net-new demand generation — the growth metric every CMO actually cares about — and it was invisible under standard measurement.
Step-by-Step Tutorial: Implementing Full-Funnel Measurement with LTS
Prerequisites
Before you can implement LTS measurement, you need:
- An active Amazon Ads account with active campaigns running across at least two funnel stages (awareness/consideration + purchase)
- Access to Amazon Marketing Cloud (AMC) — Amazon’s privacy-safe data clean room (requires Amazon Ads relationship and data processing agreement)
- Minimum 12 months of historical campaign and sales data within the Amazon ecosystem for calibration accuracy
- A defined list of new-to-brand engagement events you want to track: brand searches, product page views, add-to-cart events at minimum
- Internal alignment on what constitutes a “new-to-brand” shopper (typically someone who has not purchased from your brand in the prior 12 months)
Phase 1: Establish Your Baseline Measurement Architecture
Step 1: Audit your current attribution setup.
Pull your last 90 days of campaign data across all funnel stages. Document the attribution window settings for each campaign type. For most Amazon advertisers, this defaults to 14 days for click-through attribution and 1 day for view-through. Note where consideration and awareness campaigns (typically Sponsored Brands Video, Streaming TV ads, or Online Video) are being evaluated against these same windows — this is where the measurement distortion is occurring.
Step 2: Map your customer journey stages to Amazon Ads formats.
Create a document that maps each stage of your funnel to the ad formats you’re running:
- Upper funnel (Awareness): Streaming TV (STV), Online Video (OLV), Audio Ads
- Mid funnel (Consideration): Sponsored Brands, Sponsored Display, Custom Image Display
- Lower funnel (Purchase): Sponsored Products, Sponsored Brands (keyword-targeted)
This mapping becomes your foundation for interpreting LTS data by stage.
Step 3: Define your new-to-brand engagement events.
Work with your Amazon Ads account team to formally define the behavioral signals you want LTS to value. According to the research report, the standard LTS valuation model captures brand searches, product page views, and add-to-cart actions as distinct engagement types. You can weight the importance of each based on your historical data — a brand search typically carries higher purchase predictive value than a product view, and both carry higher value than a display ad impression.
Phase 2: Configure LTS Measurement Inside Amazon Marketing Cloud
Step 4: Request LTS access through your Amazon Ads account team.
LTS is not self-serve as of early 2026. You need to work with an Amazon Ads managed account team or eligible agency partner to enable LTS reporting for your account. If you’re running through an agency, confirm they have AMC access — this is a prerequisite for the validation layer.
Step 5: Set the historical calibration window.
LTS uses a rolling 12-month lookback of your brand’s shopper signals to calibrate the valuation model. When onboarding, your Amazon Ads team will configure this lookback period. Ensure your historical data is complete and free of anomalies (seasonal spikes, out-of-stock periods) that could skew the calibration. Flag any major business events (product launches, recalls, pricing changes) that occurred in that window.
Step 6: Configure AMC queries to surface LTS data alongside standard metrics.
Inside Amazon Marketing Cloud, you’ll write SQL-based queries to pull LTS-attributed value alongside your standard purchase attribution data. A typical query structure will join your impression and click data against the LTS output table, grouping results by campaign, ad format, and engagement type. Here is a conceptual query structure:
SELECT
  campaign_name,
  ad_format,
  SUM(standard_14day_roas) AS standard_roas,
  SUM(lts_attributed_value) AS lts_value,
  SUM(new_to_brand_engagements) AS ntb_engagements,
  SUM(lts_attributed_value) / SUM(spend) AS lts_roas
FROM
  amc_lts_attribution_table
JOIN
  campaign_data ON campaign_data.campaign_id = amc_lts_attribution_table.campaign_id
WHERE
  date_range BETWEEN '2025-10-01' AND '2026-03-01'
GROUP BY
  campaign_name, ad_format
ORDER BY
  lts_roas DESC;
This pulls a side-by-side comparison of standard 14-day ROAS versus LTS-attributed ROAS for each campaign type, which is the primary output you need for budget reallocation decisions.
Phase 3: Run Your First LTS Analysis
Step 7: Pull a baseline LTS report for your last complete quarter.
Start with Q4 2025 or Q3 2025 — a period where you have complete data. Configure your AMC query to compare consideration campaign performance under standard attribution versus LTS. Expect significant variance. As documented in the CPG case study in the research report, brands often see their consideration campaigns look 30-40% weaker under standard measurement than they actually perform under LTS.
Step 8: Segment results by new-to-brand versus existing customers.
One of LTS’s most valuable outputs is the separation of new-to-brand engagement value from repeat customer value. Pull a segmented report that shows what percentage of your LTS-attributed value came from shoppers who had never interacted with your brand in the prior 12 months. According to the research report, this figure can represent more than half of total incremental value — which means standard measurement is systematically undervaluing your new customer acquisition efforts.
Step 9: Validate against historical data.
This is the step that transforms LTS from an interesting model into an auditable metric. Using AMC’s historical data capabilities, compare your LTS model’s predictions for a prior period against what actually happened in subsequent purchase data. For example, if LTS predicted that Q2 2025 consideration campaigns would generate X dollars in future sales over 6 months, check Q4 2025 actual purchase data for those attributed shopper cohorts. This validation step is what earns internal credibility for the methodology.
Phase 4: Apply LTS Insights to Budget Decisions
Step 10: Build a side-by-side campaign performance dashboard.
Create a reporting view that shows, for every campaign cluster, both the standard ROAS and the LTS ROAS. Format this as a table with columns for: Campaign Type, Ad Format, Spend, Standard 14-day ROAS, LTS ROAS, New-to-Brand Engagement Volume, and LTS vs. Standard Delta. This becomes your primary budget optimization tool.
Step 11: Rebalance funnel investment based on true LTS efficiency.
Identify campaigns where the LTS ROAS is meaningfully higher than the standard ROAS — these are your under-invested upper-funnel programs. Bring this data into your next budget planning cycle with a concrete reallocation recommendation: shift X% of lower-funnel spend to consideration campaigns, with LTS as the accountability metric for those dollars. The research report’s actionable insights explicitly recommend using LTS data to defend and grow mid- and upper-funnel media investment.
Step 12: Set LTS as the primary KPI for brand-building campaigns going forward.
Stop reporting reach, frequency, and brand lift as standalone metrics for awareness campaigns. Report them alongside LTS value. This shifts the internal conversation from “we ran awareness and people saw it” to “we ran awareness and it generated $X in attributable long-term sales value, with Y% coming from new-to-brand shoppers.”
Expected Outcomes
After one full quarter of LTS-driven measurement and one budget reallocation cycle, expect:
- A clearer picture of which creative formats and audience segments drive the highest long-term purchase intent
- Improved defense of upper-funnel campaign budgets in quarterly reviews
- A measurable increase in new-to-brand shopper acquisition tracked by LTS
- Better alignment between brand and performance teams using a shared dollar-value metric
Real-World Use Cases
Use Case 1: CPG Brand Defending a CTV Budget
Scenario: A consumer packaged goods brand runs a $2M Streaming TV campaign targeting new category entrants. Standard 14-day ROAS looks poor compared to Sponsored Products. The CFO is pushing to cut the STV budget and shift it to retargeting.
Implementation: The brand activates LTS measurement, identifying all brand searches, product views, and purchases traced back to STV-exposed shoppers over a 90-day window. They validate the model in AMC against prior period data.
Expected Outcome: The LTS analysis reveals that STV drove significantly higher new-to-brand engagement than Sponsored Products, with a long-term ROAS that justifies the budget. The brand retains or grows the STV allocation. This mirrors the CPG case study in the research report, where consideration campaigns showed a 1.7x higher ROAS under LTS than standard measurement indicated.
Use Case 2: Agency Proving Full-Funnel Value to a Retail Client
Scenario: A performance marketing agency manages Amazon campaigns for a mid-market retail brand. The brand has historically spent 80% of its budget on Sponsored Products. The agency wants to introduce upper-funnel campaigns but cannot justify them to the client using existing metrics.
Implementation: The agency uses AMC and LTS to run a retrospective analysis of the brand’s historical shopper data, identifying how many purchases over the prior year came from shoppers who first interacted with a non-purchase ad format. This quantifies the hidden value of upper-funnel touchpoints in dollar terms the client can read.
Expected Outcome: The agency presents a data-driven case for shifting 20-25% of budget to consideration-stage campaigns, with LTS as the accountability metric. The client approves, and the agency now has a defensible measurement framework for full-funnel spend.
Use Case 3: Brand Identifying High-Value Customer Journey Touchpoints
Scenario: A health and beauty brand runs campaigns across STV, Sponsored Brands, and Sponsored Products. They want to know which touchpoint sequence produces the highest lifetime value customers — not just who converts first.
Implementation: Using AMC, the brand runs path-to-purchase queries joined against LTS attribution data, segmenting shopper cohorts by their first brand interaction touchpoint. They compare LTS value across cohorts: STV-first vs. Sponsored Brands-first vs. Sponsored Products-first.
Expected Outcome: The analysis reveals that shoppers who first encountered the brand through STV have higher average order values and repurchase rates over a 6-month window — even though their initial ROAS looks lower. The brand uses this to build a sequenced media strategy: STV for new-to-brand shoppers, followed by Sponsored Brands retargeting for considerers.
Use Case 4: Rebalancing Seasonal Campaign Strategy
Scenario: A brand historically front-loads its budget in the final 2 weeks before peak shopping seasons (Black Friday, Prime Day), when purchase intent is highest. They want to test whether earlier upper-funnel investment improves total season ROAS.
Implementation: The brand uses LTS to analyze the prior year’s data, tracing which Q3 awareness-stage exposures led to Q4 purchases among new-to-brand shoppers. They calculate the LTS-attributed value of those early exposures.
Expected Outcome: The analysis shows that shoppers exposed to consideration campaigns in the 60-90 days before peak season had higher conversion rates and larger basket sizes during peak. The brand shifts 15% of peak-season budget to pre-season consideration campaigns, using LTS to track return.
Common Pitfalls
Pitfall 1: Treating LTS as a replacement for short-term ROAS.
LTS and standard ROAS measure different things. Shutting down your short-term performance metrics because LTS shows better numbers for consideration campaigns is a mistake. Use them in tandem: short-term ROAS optimizes in-flight campaign decisions; LTS informs strategic budget allocation. As the research report recommends, integrate both — don’t silo them.
Pitfall 2: Insufficient historical data for accurate calibration.
LTS requires 12 months of historical shopper signals for accurate model calibration. Brands with less than a year of Amazon Ads history, or those that have undergone significant catalog or pricing changes, will get less reliable LTS outputs. If your data has gaps or anomalies, flag them explicitly in your AMC configuration so they don’t distort the baseline.
Pitfall 3: Ignoring the new-to-brand segmentation.
It’s tempting to look only at the aggregate LTS ROAS number. The more strategically valuable output is the new-to-brand contribution percentage. According to the research report, more than half of incremental LTS value in the CPG case study came from new-to-brand engagements. If you skip this segmentation, you miss the primary signal for demand generation effectiveness.
Pitfall 4: Failing to validate the model against historical actuals.
LTS is a predictive valuation model. Without running the AMC validation step — comparing model predictions against what actually happened in subsequent periods — you have no basis for trusting the outputs or defending them to skeptical stakeholders. Build validation into your implementation process, not as an afterthought.
Pitfall 5: Applying LTS logic to products with short consideration cycles.
LTS is most powerful for products where customers take weeks or months to decide: considered purchases, new category entries, high-ticket items, subscription products. For commodity re-purchases with 1-2 day consideration cycles, the delta between standard attribution and LTS will be minimal. Match your measurement methodology to your product’s actual purchase cadence.
Expert Tips
1. Segment LTS by audience cohort, not just campaign.
The most powerful LTS analyses compare long-term value across audience segments — new-to-category shoppers versus brand switchers versus lapsed customers. Different segments have different LTS profiles, and that shapes both targeting strategy and creative messaging.
2. Use LTS findings to brief creative teams.
If LTS data shows that brand searches spike after STV exposures but not after display ads, that’s a signal about creative format effectiveness that should inform your next production brief. LTS is not just a measurement tool; it’s a creative strategy input.
3. Negotiate agency contracts around LTS, not just short-term ROAS.
If you work with performance marketing agencies compensated on ROAS targets, those incentives push them toward lower-funnel spend. Building LTS into agency KPIs and compensation structures aligns incentives with long-term brand growth. As noted in the research report, this integration of short- and long-term metrics enables more holistic budget optimization.
4. Run quarterly LTS calibration checks.
The model’s historical calibration drifts as market conditions, competitive dynamics, and product catalogs evolve. Schedule quarterly AMC validation queries to ensure your LTS outputs remain accurate and that you’re capturing any significant shifts in purchase journey behavior.
5. Build LTS into board-level reporting.
The ability to express brand-building investment in dollars — not impressions or brand lift points — transforms the conversation at the executive level. Build a one-page LTS performance summary into your quarterly board deck, showing standard ROAS alongside LTS ROAS for upper-funnel programs. This is how brand investment gets protected in downturns.
FAQ
Q: Is LTS only available for Amazon advertisers?
LTS as described — using an authenticated identity graph and Amazon shopping behavior signals — is specific to Amazon Ads and the Amazon Marketing Cloud ecosystem. The methodology of valuing pre-purchase engagement signals and extending measurement windows is applicable in other ecosystems (Google’s data-driven attribution, Meta’s conversion modeling), but the specific LTS metric tied to Amazon’s identity graph requires an Amazon Ads relationship. See the original Digiday source for platform context.
Q: How is LTS different from view-through attribution?
View-through attribution counts purchases made within a window after an ad exposure, without requiring a click. LTS goes further: it values pre-purchase behaviors (brand searches, product views, add-to-carts) as monetary outcomes, not just the final purchase. It also uses authenticated identity resolution rather than probabilistic matching, and calibrates valuations to each brand’s specific historical shopper signals rather than applying a generic attribution credit.
Q: What’s a realistic timeline from LTS setup to actionable data?
Working with an Amazon Ads managed team, expect 4-6 weeks for onboarding, data access configuration, and initial AMC query setup. Your first retrospective LTS report (analyzing the prior quarter’s campaigns) can typically be completed within 6-8 weeks of starting the process. Forward-looking LTS measurement, where you’re tracking campaigns as they run, becomes operational after the initial calibration period.
Q: How do we handle attribution overlap between LTS and standard reporting?
LTS and standard attribution will produce different numbers for the same campaigns, which initially creates confusion in dashboards that show both. The cleanest approach is to run separate reporting views: one optimized for in-flight campaign management (standard ROAS, daily/weekly), one for strategic budget decisions (LTS ROAS, quarterly). Avoid blending the two in a single ROAS metric — the methodologies are different by design and should be interpreted separately.
Q: Can LTS measurement be used to justify budget increases rather than just reallocations?
Yes — and this is one of its most strategically valuable applications. The research report notes that only 53% of marketing leaders are confident in measuring their total spend ROI. LTS gives CFOs and finance teams a credible, dollar-denominated framework for evaluating incremental brand-building investment. If your LTS ROAS on consideration campaigns is 1.7x higher than standard measurement indicated, the case for incremental investment is far stronger than “trust us, brand matters.”
Bottom Line
Long-Term Sales measurement is not a philosophical argument for the value of brand advertising — it’s an auditable, dollar-denominated methodology that assigns monetary value to the customer journey steps that standard attribution windows systematically ignore. The CPG case study documented in the research report is a concrete proof point: the same campaigns that looked 34% worse on standard ROAS actually generated 70% more sales when the full journey was measured, with a 1.7x improvement in true ROAS. Implementing LTS requires Amazon Marketing Cloud access, a 12-month calibration dataset, and organizational willingness to manage two parallel measurement frameworks — one for tactical optimization, one for strategic budget decisions. The brands that get there first will have a structural advantage in defending and growing upper-funnel investment when every competitor is still arguing about reach and frequency. The measurement gap has a solution; the question is whether your team is willing to implement it.


0 Comments