

Creator marketing has a measurement problem that costs brands real money: they run campaigns across multiple platforms, generate solid engagement, then scramble to reconcile data between six different dashboards before writing an end-of-quarter report that still doesn’t connect creator spend to revenue. CreatorIQ and Sprinklr’s newly announced integration is a direct answer to that problem, pulling creator intelligence, organic social, paid amplification, and social listening into a single operating environment. This tutorial walks you through what the integration does, why it matters for your measurement stack, and exactly how to build a unified creator reporting workflow using these two platforms.
What This Is
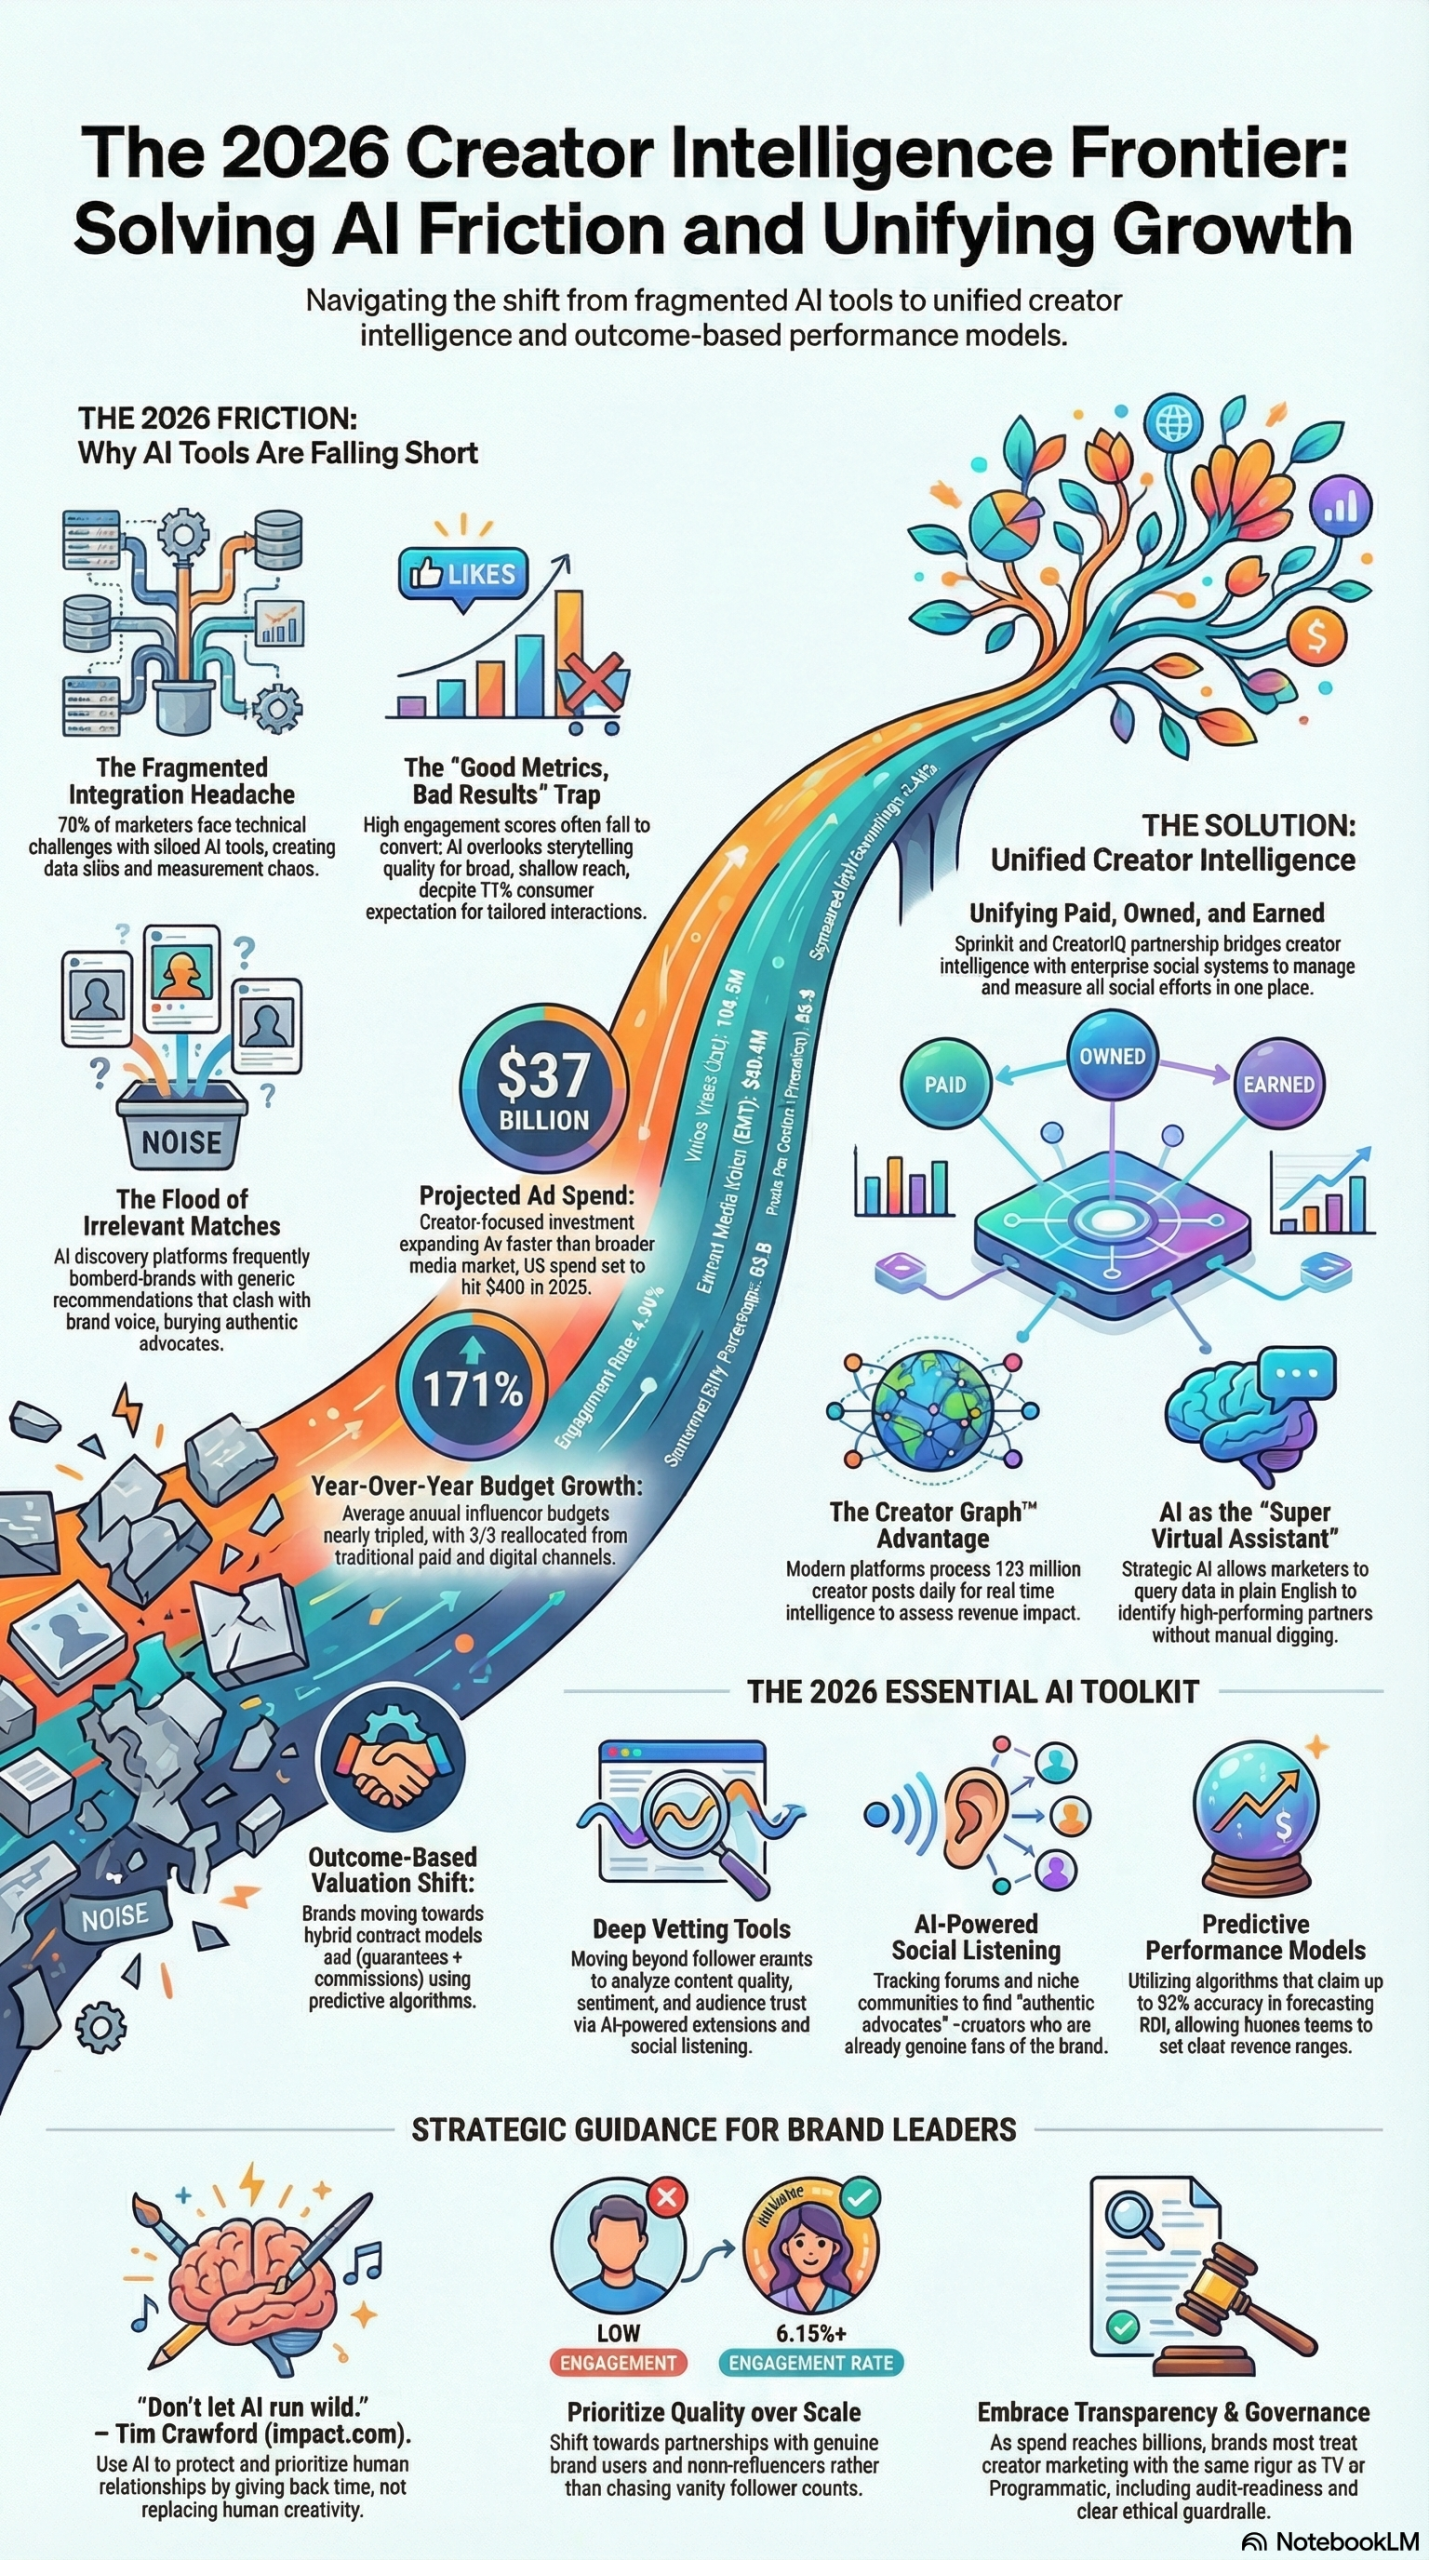
CreatorIQ and Sprinklr have formed a strategic integration that connects creator marketing intelligence with enterprise social media management at the data layer. According to the Digiday report published March 31, 2026, CreatorIQ’s data pipeline — which processes 123 million creator posts daily — now flows directly into Sprinklr’s unified reporting environment, which measures paid, owned, and earned content alongside social listening signals.
To understand why this matters architecturally, you need to know what each platform does independently:
CreatorIQ is a creator intelligence platform built for enterprise brands and agencies. Its core value is ingesting raw creator data at scale — posts, engagement events, audience demographics, brand safety flags — and surfacing actionable match scores and performance predictions. It connects directly to YouTube and Meta APIs to access verified, first-party audience data rather than estimated reach numbers. When CreatorIQ evaluates a creator, it’s pulling authentic performance data, not panel-based estimates.
Sprinklr is a Unified Customer Experience Management (Unified-CXM) platform. It’s where enterprise social teams manage publishing, paid social campaigns, customer care, and reporting. Until this integration, Sprinklr’s reporting suite covered owned and paid channels comprehensively but had limited visibility into earned creator performance — the influencer posts that weren’t directly boosted through paid media.
The integration bridges that gap. CreatorIQ’s creator performance data flows into Sprinklr as a native data source, so a brand’s social analytics team can see, in one dashboard: what their paid social is doing, what their owned content is doing, and what their creator partners are doing — segmented, attributed, and comparable in the same units.
Early testers of the integration cited in the Digiday article include a global streaming platform, a multinational e-commerce company, and a consumer software company — all organizations that run creator programs at scale alongside significant paid social investments. These aren’t small pilots; they’re enterprise validation that the data architecture holds up under real campaign load.
The broader context: as the NotebookLM research report documents, 70% of marketers have already implemented AI to streamline discovery and measurement, but they still face fragmented tools and siloed data as the primary workflow friction in 2026. This integration is designed to collapse that friction by eliminating the “chair swivel” — the constant context-switching between systems that consumes analyst time and introduces attribution errors.
Why It Matters
The core problem this integration solves is a budget credibility gap that has plagued creator marketing for years. As Matt Barash, Chief Commercial Officer at Nova, stated in the Digiday article: “For years, creator marketing has struggled to win serious budget allocation, not because it didn’t work, but because it couldn’t be measured in the same language as paid media.”
That’s the practitioner reality. When you bring a creator campaign performance deck to a CFO who thinks in CPM, CPA, and ROAS, a slide showing “12.4 million impressions and 6% engagement rate” doesn’t close the budget conversation. It opens a skeptical one. Paid media has decades of standardized measurement infrastructure. Creator marketing, until very recently, did not.
The Sprinklr integration changes the reporting language. When creator data lives in the same environment as paid social data, you can run comparisons that CFOs and CMOs actually use to make allocation decisions: cost per acquisition across creator tiers vs. paid social, earned media value relative to boosted spend, conversion attribution across the full funnel. These aren’t new calculations — they’ve always been theoretically possible. They’ve just required custom data engineering work that most teams couldn’t sustain.
For practitioners, the workflow impact is significant. According to the research report, the industry is transitioning toward what analysts are calling the “Era of Efficacy” — a shift away from vanity metrics toward unified technology stacks with predictive performance modeling. The CreatorIQ-Sprinklr integration is a direct implementation of that transition.
Who benefits most:
- Enterprise brands running creator programs alongside paid social at scale, where measurement reconciliation consumes significant analyst bandwidth
- Agencies managing multi-brand creator rosters who need consolidated reporting without building custom data pipelines
- Performance marketing teams who have historically viewed creator as an unaccountable line item and need attribution data to justify or grow the budget
- Social media strategists who want to see creator, organic, and paid performance in context rather than in separate reporting environments
What makes this different from existing alternatives is the depth of the CreatorIQ data layer. Platforms that have attempted creator-social integrations before have typically relied on estimated reach data or aggregated benchmarks. CreatorIQ’s direct API connections to YouTube and Meta, processing 123 million posts daily, means the data flowing into Sprinklr reflects verified platform-level performance — not modeled estimates.
The Data
The investment case for getting creator measurement right is substantial. The research report documents the scale of what’s now at stake:
| Metric | 2024–2026 Data |
|---|---|
| U.S. Creator Economy Investment (2025) | $37 billion (projected) |
| Year-over-Year Budget Growth | 26% (4× faster than broader media market) |
| Annual Influencer Budget Increase Since 2024 | 171% |
| Marketers Using AI for Discovery/Measurement | 70% |
| Improvement in Conversion Rates via Predictive Selection | 23% |
| Consumer Enthusiasm for AI-Generated Creator Content (2023) | 60% |
| Consumer Enthusiasm for AI-Generated Creator Content (2025) | 26% |
| Advertisers Concerned AI Will Erode Human Connection | 95% |
| Marketers with No Plans for Virtual Influencers | 89% |
Creator Performance Benchmarks (2024–2026) — based on data from over 1 million creators and 20,000 brands (research report):
| KPI Category | Metric | 2024–2026 Average |
|---|---|---|
| Reach | Engagement Rate | 4.90% |
| Content Performance | Video Views (Estimated) | 196.5 million |
| Earned Media | EMV per Creator | $522,100 |
| Content Performance | Average Likes per Content Piece | 19.5 million |
| Niche Tier | Nano-influencer Engagement Rate | 6.15%–6.76% |
The engagement rate differential between nano-influencers (6.15%–6.76%) and the broader 4.90% average benchmark is a critical planning data point. It means that the creator tier most frequently overlooked in enterprise planning — creators with fewer than 15,000 followers — consistently outperforms the industry average on the metric that most directly predicts audience action. The CreatorIQ-Sprinklr integration supports tier-level segmentation and comparison, which is what makes acting on this data operationally practical at scale.
Step-by-Step Tutorial: Building a Unified Creator Measurement Workflow
This walkthrough assumes you have active accounts on both CreatorIQ and Sprinklr. The integration is designed for enterprise deployments; both platforms offer implementation support for initial configuration.
Phase 1: Prerequisites and Account Setup
Before you can build unified reporting, you need the data foundations in place on both sides.
CreatorIQ prerequisites:
– Active CreatorIQ enterprise account with API access enabled
– At least one active or completed campaign with tracked creator posts
– YouTube and/or Meta API connections authenticated (this gives you verified first-party audience data)
– Brand safety parameters configured — these define what content CreatorIQ will and won’t surface
– Creator roster tagged by tier (nano, micro, macro, mega) and campaign objective (awareness, conversion, retention)
Sprinklr prerequisites:
– Sprinklr enterprise account with the Analytics module active
– Paid social accounts connected (Meta, LinkedIn, TikTok, YouTube, etc.)
– Owned social profiles connected and publishing history populated
– Custom KPI definitions set for your organization (this is important — Sprinklr lets you define what “success” means in your terms, not just platform defaults)
– User roles configured so your creator team and your paid social team can both access relevant dashboard views
Integration authentication:
Work with both platform’s implementation teams to authenticate the CreatorIQ data connector within Sprinklr. This involves generating an API token in CreatorIQ and entering it in Sprinklr’s data source management settings. The data sync is typically configured as a nightly batch with near-real-time options available for active campaigns.
Phase 2: Define Your Measurement Framework Before Connecting Data
This is the step most teams skip and regret. Before you wire the platforms together, define what questions you’re actually trying to answer. Unified dashboards that aren’t organized around specific business questions become expensive noise generators.
The measurement questions that the CreatorIQ-Sprinklr integration is built to answer include:
- Attribution: Which creator drove the most tracked conversions last month?
- Efficiency comparison: What is the cost-per-conversion across creator tiers vs. equivalent paid social placements?
- Content quality: Which creator’s content performed best when boosted through paid amplification?
- Audience overlap: Where does the creator’s organic audience intersect with our paid retargeting pools?
- Earned media value: What is the total EMV generated by creator activity relative to our paid investment in the same period?
Write these questions down. They become your custom metric definitions and your dashboard layout logic in Sprinklr.
Phase 3: Configure CreatorIQ Campaign Tracking
For data to flow correctly into Sprinklr, your CreatorIQ campaigns need to be configured with proper tracking parameters.
Step 1: Set up UTM parameters for all creator content. In CreatorIQ, navigate to Campaign Settings and enable UTM auto-generation. This tags all creator-tracked URLs with campaign, source, medium, and content parameters that will appear in your web analytics and can be imported into Sprinklr as conversion data.
Step 2: Define creator tiers with consistent tagging. In your CreatorIQ roster, tag each creator with a tier label (nano/micro/macro/mega) and a primary campaign objective. This segmentation will pass through to Sprinklr, allowing you to filter and compare tier performance in your unified reports.
Step 3: Enable EMV calculation. CreatorIQ calculates Earned Media Value based on platform engagement benchmarks. Make sure EMV is enabled in your campaign settings so this metric flows through to Sprinklr as a comparable unit against your paid media CPM spend.
Step 4: Activate brand safety monitoring. Before any creator posts are included in your unified reporting, configure CreatorIQ’s brand safety layer to flag or exclude content that doesn’t meet your brand guidelines. This prevents contaminated data from pulling down your aggregate performance numbers in Sprinklr.
Phase 4: Build Your Unified Dashboard in Sprinklr
Once the data connection is live and CreatorIQ campaign data is flowing in, build your reporting environment.
Step 1: Create a custom dashboard in Sprinklr Analytics. Name it something your whole team will recognize (e.g., “Creator + Paid Unified Performance Q2 2026”).
Step 2: Add data source widgets. Sprinklr’s widget library lets you pull from multiple data sources into a single canvas. Add widgets for:
– Paid social performance (from your connected ad accounts)
– Owned social performance (from your connected profiles)
– CreatorIQ earned performance (from the integrated data source)
– Social listening volume (from Sprinklr’s listening module)
Step 3: Build comparison panels. The highest-value view is a side-by-side comparison of paid CPM vs. creator CPM, and paid CPA vs. creator CPA. In Sprinklr, you can create blended metrics that calculate these comparisons automatically. Use Sprinklr’s custom formula builder to define: Creator CPA = Creator Campaign Spend / Tracked Creator Conversions.
Step 4: Configure Sprinklr Copilot queries. The research report documents that tools like “Sprinklr Copilot” allow marketers to query data in plain English. Set up saved queries for your most frequent reporting questions — for example: “Which creator partner drove the highest conversion rate in the last 30 days?” or “Show me EMV by creator tier this quarter.” These become one-click insights for your team.
Step 5: Set up automated alerts. Configure Sprinklr to alert your team when creator performance metrics cross defined thresholds — either positively (a creator’s content is significantly outperforming benchmarks, flag for paid amplification) or negatively (engagement rate dropping below 2%, flag for review).
Phase 5: Run Your First Unified Performance Review
Once the dashboard is live, run your first unified performance review using this structured process:
- Pull the trailing 30-day view across all three channels (paid, owned, creator)
- Sort creator performance by conversion rate, not by follower count or engagement rate alone
- Identify your top 3 creators by CPA — these are candidates for paid amplification (boosting their organic content through your ad accounts)
- Compare nano-influencer tier performance against your macro-creator tier on engagement rate. Given that nano-influencers consistently deliver 6.15%–6.76% engagement rates vs. the 4.90% industry average (research report), this comparison often reveals under-invested budget opportunities.
- Calculate your blended ROAS across creator and paid channels using your Sprinklr custom formula
- Use the Copilot natural language query to surface any anomalies you might have missed in the structured view
Expected outcome: After 60–90 days of consistent data flowing through this system, you will have enough unified data to build a creator budget allocation model that speaks the same language as your paid media planning. That’s the artifact you need to get creator marketing treated as a performance channel — not a brand awareness experiment — in budget discussions.
Real-World Use Cases
Use Case 1: The Global Streaming Platform
Scenario: A major streaming service runs creator campaigns on YouTube and Instagram to support new show launches. Previously, their creator team used CreatorIQ in isolation while their paid social team used Sprinklr, and the two data sets never met.
Implementation: After deploying the integration, they configure creator campaigns in CreatorIQ with UTM parameters tied to sign-up tracking. CreatorIQ data flows into their Sprinklr dashboard alongside their paid pre-roll and social ad performance. They build a blended CPA widget comparing creator-driven sign-ups vs. paid social sign-ups by campaign.
Expected Outcome: The paid team identifies that three specific micro-creators driving entertainment content are converting at a CPA 40% lower than equivalent paid placements. They boost those creators’ top-performing posts through their ad accounts, applying CreatorIQ’s audience match data to target lookalikes of the creators’ verified followers. The result is a hybrid creator-paid strategy that outperforms pure paid at scale.
Use Case 2: The E-Commerce Brand Running Multi-Tier Creator Programs
Scenario: A multinational e-commerce brand works with a mix of macro-creators for awareness and nano-creators for direct sales. Their previous measurement approach evaluated these tiers separately and couldn’t compare them on a common efficiency metric.
Implementation: They use CreatorIQ’s tier tagging to segment creator performance in Sprinklr. They build a comparison table in their Sprinklr dashboard showing cost-per-sale, average order value, and return rate broken down by creator tier. The research report notes that nano-influencers (under 15k followers) deliver engagement rates between 6.15% and 6.76%, and this brand’s own data confirms the pattern.
Expected Outcome: The unified data reveals that their nano-creator tier is driving 3× more tracked purchases per dollar spent than their macro tier. They reallocate 20% of their macro-creator budget to nano-creators, using CreatorIQ’s discovery tools to identify additional nano-creators in their product category.
Use Case 3: The Agency Managing Multiple Brand Accounts
Scenario: A performance marketing agency manages creator programs for eight brands across CPG, tech, and retail. Each brand has separate CreatorIQ and Sprinklr accounts. The agency needs consolidated cross-brand reporting without giving clients visibility into each other’s data.
Implementation: The agency configures separate Sprinklr workspaces per client but builds a master reporting template that maps to the same unified metrics across all eight brands. They use CreatorIQ’s roster management to maintain creator relationships at the agency level while feeding performance data into each client’s individual Sprinklr environment.
Expected Outcome: The agency reduces end-of-month reporting time from approximately 12 hours per brand to 3 hours per brand by eliminating manual data reconciliation. More importantly, they can identify pattern-level insights across brands — for example, that a specific content format consistently outperforms in their tech clients but underperforms in CPG — and apply those learnings proactively.
Use Case 4: The Brand Defending Creator Budget in Planning Season
Scenario: A consumer software company’s CMO is skeptical of creator marketing ROI heading into annual budget planning. The creator marketing manager needs to make a data-based case for maintaining or growing their creator investment.
Implementation: Using the CreatorIQ-Sprinklr unified dashboard, they pull a full-year comparison showing creator-driven attribution vs. paid social attribution with consistent CPA and ROAS calculations. They use Sprinklr Copilot to generate a summary report that automatically highlights their top-performing creator-driven moments and their contribution to pipeline.
Expected Outcome: The CMO receives a creator performance report formatted in the same metrics as the paid media report. As Barash of Nova noted in the Digiday article, the inability to measure creator marketing “in the same language as paid media” was historically the budget credibility problem. That problem is now solved by the unified data environment.
Common Pitfalls
1. Treating the dashboard as a replacement for human judgment.
Becca Bahrke of Illuminate Social warned in the Digiday article that creator storytelling “doesn’t always translate neatly to a dashboard.” A creator who underperforms on standard metrics might still be brand-critical for category authority or trust-building. Don’t automate creator decisions entirely off dashboard scores — use the data to inform selection, then apply human judgment. As Todd Crawford of impact.com put it in the research report: “You can let AI help you, but don’t let AI run wild.”
2. Configuring UTM parameters inconsistently across campaigns.
If UTM parameters are generated inconsistently — different naming conventions across campaigns or team members — your conversion attribution in Sprinklr will be fragmented and unreliable. Standardize UTM taxonomy before you start the integration and enforce it in CreatorIQ’s campaign setup settings.
3. Comparing vanity metrics instead of outcome metrics.
The research report identifies the “vanity metric trap” as a primary challenge in 2026 creator measurement. High engagement numbers do not equal high ROI. When you build your Sprinklr dashboard, anchor your primary KPIs to outcome metrics (CPA, ROAS, attributed revenue) rather than engagement rate or impressions. Those secondary metrics belong in a supporting view, not your headline reporting.
4. Ignoring brand safety configuration before data flows.
If you enable the data integration without configuring brand safety filters in CreatorIQ, you may pull performance data from creator posts that include content misaligned with your brand guidelines. Use CreatorIQ’s brand safety layer to define acceptable content parameters before syncing data.
5. Skipping the measurement framework definition in Phase 2.
Teams that connect the platforms and then try to figure out what to measure end up with cluttered, underused dashboards. The measurement framework — the specific questions you need the data to answer — must be defined first. It determines your custom metrics, your dashboard layout, and how you’ll actually use the system to make decisions.
Expert Tips
1. Use predictive performance data to set creator contract terms.
CreatorIQ’s predictive analytics can forecast conversion likelihood before a contract is signed. The research report notes that predictive selection has been shown to improve average conversion rates by 23%. Use those forecasts to structure hybrid compensation agreements: a guaranteed base fee plus performance-based commission tiers tied to tracked outcomes rather than paying flat fees based on follower count.
2. Flag top-performing organic creator posts for paid amplification in real time.
Set up Sprinklr alerts that notify your paid social team the moment a creator’s organic post crosses a performance threshold (e.g., 4%+ engagement rate within 6 hours of posting). Those are your highest-probability boosting candidates — the audience has already validated the content organically. Boosting them extends reach to lookalike audiences while paying for proven creative.
3. Use social listening to find uncontracted authentic advocates.
The research report recommends using AI-powered social listening to find creators who are already talking about your brand in niche communities — before you’ve paid them anything. These organic advocates typically demonstrate higher audience trust and lower CPAs than cold-contracted creators. In Sprinklr, configure listening streams for your brand name and product terms; in CreatorIQ, match those handles against creator profiles to evaluate before outreach.
4. Optimize creator content for AI search (GEO) alongside platform metrics.
The research report identifies Generative Engine Optimization (GEO) as a 2026 priority: creator content formatted with “answer-first” subject-matter expertise is more likely to be cited in AI-generated search summaries. Brief creators to include clear, direct answers to common category questions in their content. This extends the measurable impact of creator posts beyond platform metrics into search channel attribution.
5. Audit AI discovery recommendations quarterly for bias.
CreatorIQ’s AI discovery surfaces recommended creators based on historical performance patterns. Those patterns can encode biases — favoring creators whose demographics match historical top performers and overlooking diverse voices in niche categories. The research report explicitly recommends regularly reviewing AI recommendations to ensure they’re not excluding diverse creators. Build a quarterly bias audit into your program operations.
FAQ
Q: Does the CreatorIQ-Sprinklr integration work with all social platforms, or just Meta and YouTube?
CreatorIQ processes data from all major platforms — Instagram, TikTok, YouTube, X (Twitter), LinkedIn, and others. The verified first-party API connections are deepest on Meta and YouTube, which provide the most reliable audience demographic data. For other platforms, CreatorIQ uses platform-level data where available and verified scraping where API access is limited. The data that flows into Sprinklr reflects this — some platforms will have richer attribution data than others. Plan your measurement framework accordingly.
Q: How long does the integration take to configure?
Based on typical enterprise software deployment timelines, initial configuration (API authentication, data source connection, basic dashboard setup) can be completed in 1–2 weeks. Building out custom metrics, trained Copilot queries, and automated alerts adds another 2–4 weeks depending on your team’s familiarity with Sprinklr’s analytics environment. Both platforms offer implementation support; use it.
Q: Can nano-influencer programs be tracked as rigorously as macro-creator programs?
Yes, and this is one of the integration’s genuine advantages. The research report documents that nano-influencers (under 15,000 followers) deliver engagement rates of 6.15%–6.76%, outperforming the industry average of 4.90%. Because they’re often overlooked in enterprise programs, their CPA is frequently lower. CreatorIQ supports tier-level segmentation and Sprinklr can compare tier performance on common efficiency metrics — so nano programs can be evaluated, justified, and scaled with the same rigor as macro programs.
Q: Is AI content generation — virtual influencers, AI avatars — part of this platform ecosystem?
No, and this is worth noting explicitly. The research report documents that consumer enthusiasm for AI-generated creator content dropped from 60% in 2023 to 26% in 2025, and 89% of marketers report no plans to partner with virtual influencers or digital avatars. The CreatorIQ-Sprinklr integration is built around real creator content measurement and amplification — not AI content generation. The AI in these platforms serves analytics and workflow functions, not content creation.
Q: How do I handle attribution for creator content that lives on the creator’s channel rather than my owned properties?
This is the core attribution challenge for earned creator content. The solution is UTM-tagged links in creator posts that drive to trackable landing pages, combined with platform-level event data from Meta and YouTube APIs. CreatorIQ’s tracking layer handles UTM generation and link management; the conversion data flows back through your web analytics and into Sprinklr via the integration. For content that doesn’t include a direct link (brand mentions, organic recommendations), CreatorIQ’s EMV calculation provides a proxy valuation based on platform engagement benchmarks.
Bottom Line
The CreatorIQ and Sprinklr integration represents the most practical implementation of something the creator marketing industry has needed for a decade: a measurement architecture that lets creator performance speak the same language as paid media. With U.S. creator economy investment projected at $37 billion in 2025 — growing 4× faster than the broader media market — the pressure to account for that spend with rigorous attribution has never been higher. This integration doesn’t just solve a reporting inconvenience; it solves the budget credibility gap that has kept creator marketing from receiving serious allocation in enterprise planning.
The practical path is straightforward: standardize your UTM taxonomy in CreatorIQ, build your measurement framework before wiring the platforms together, anchor your Sprinklr dashboard to outcome metrics rather than vanity metrics, and use predictive performance data to structure creator contracts. Do those four things consistently and you’ll have a creator measurement operation that can actually defend and grow its budget in performance marketing environments.
The tools are now sophisticated enough to run the analysis. What determines whether organizations succeed with this integration is the discipline to define what they’re measuring before they start measuring it.


0 Comments