

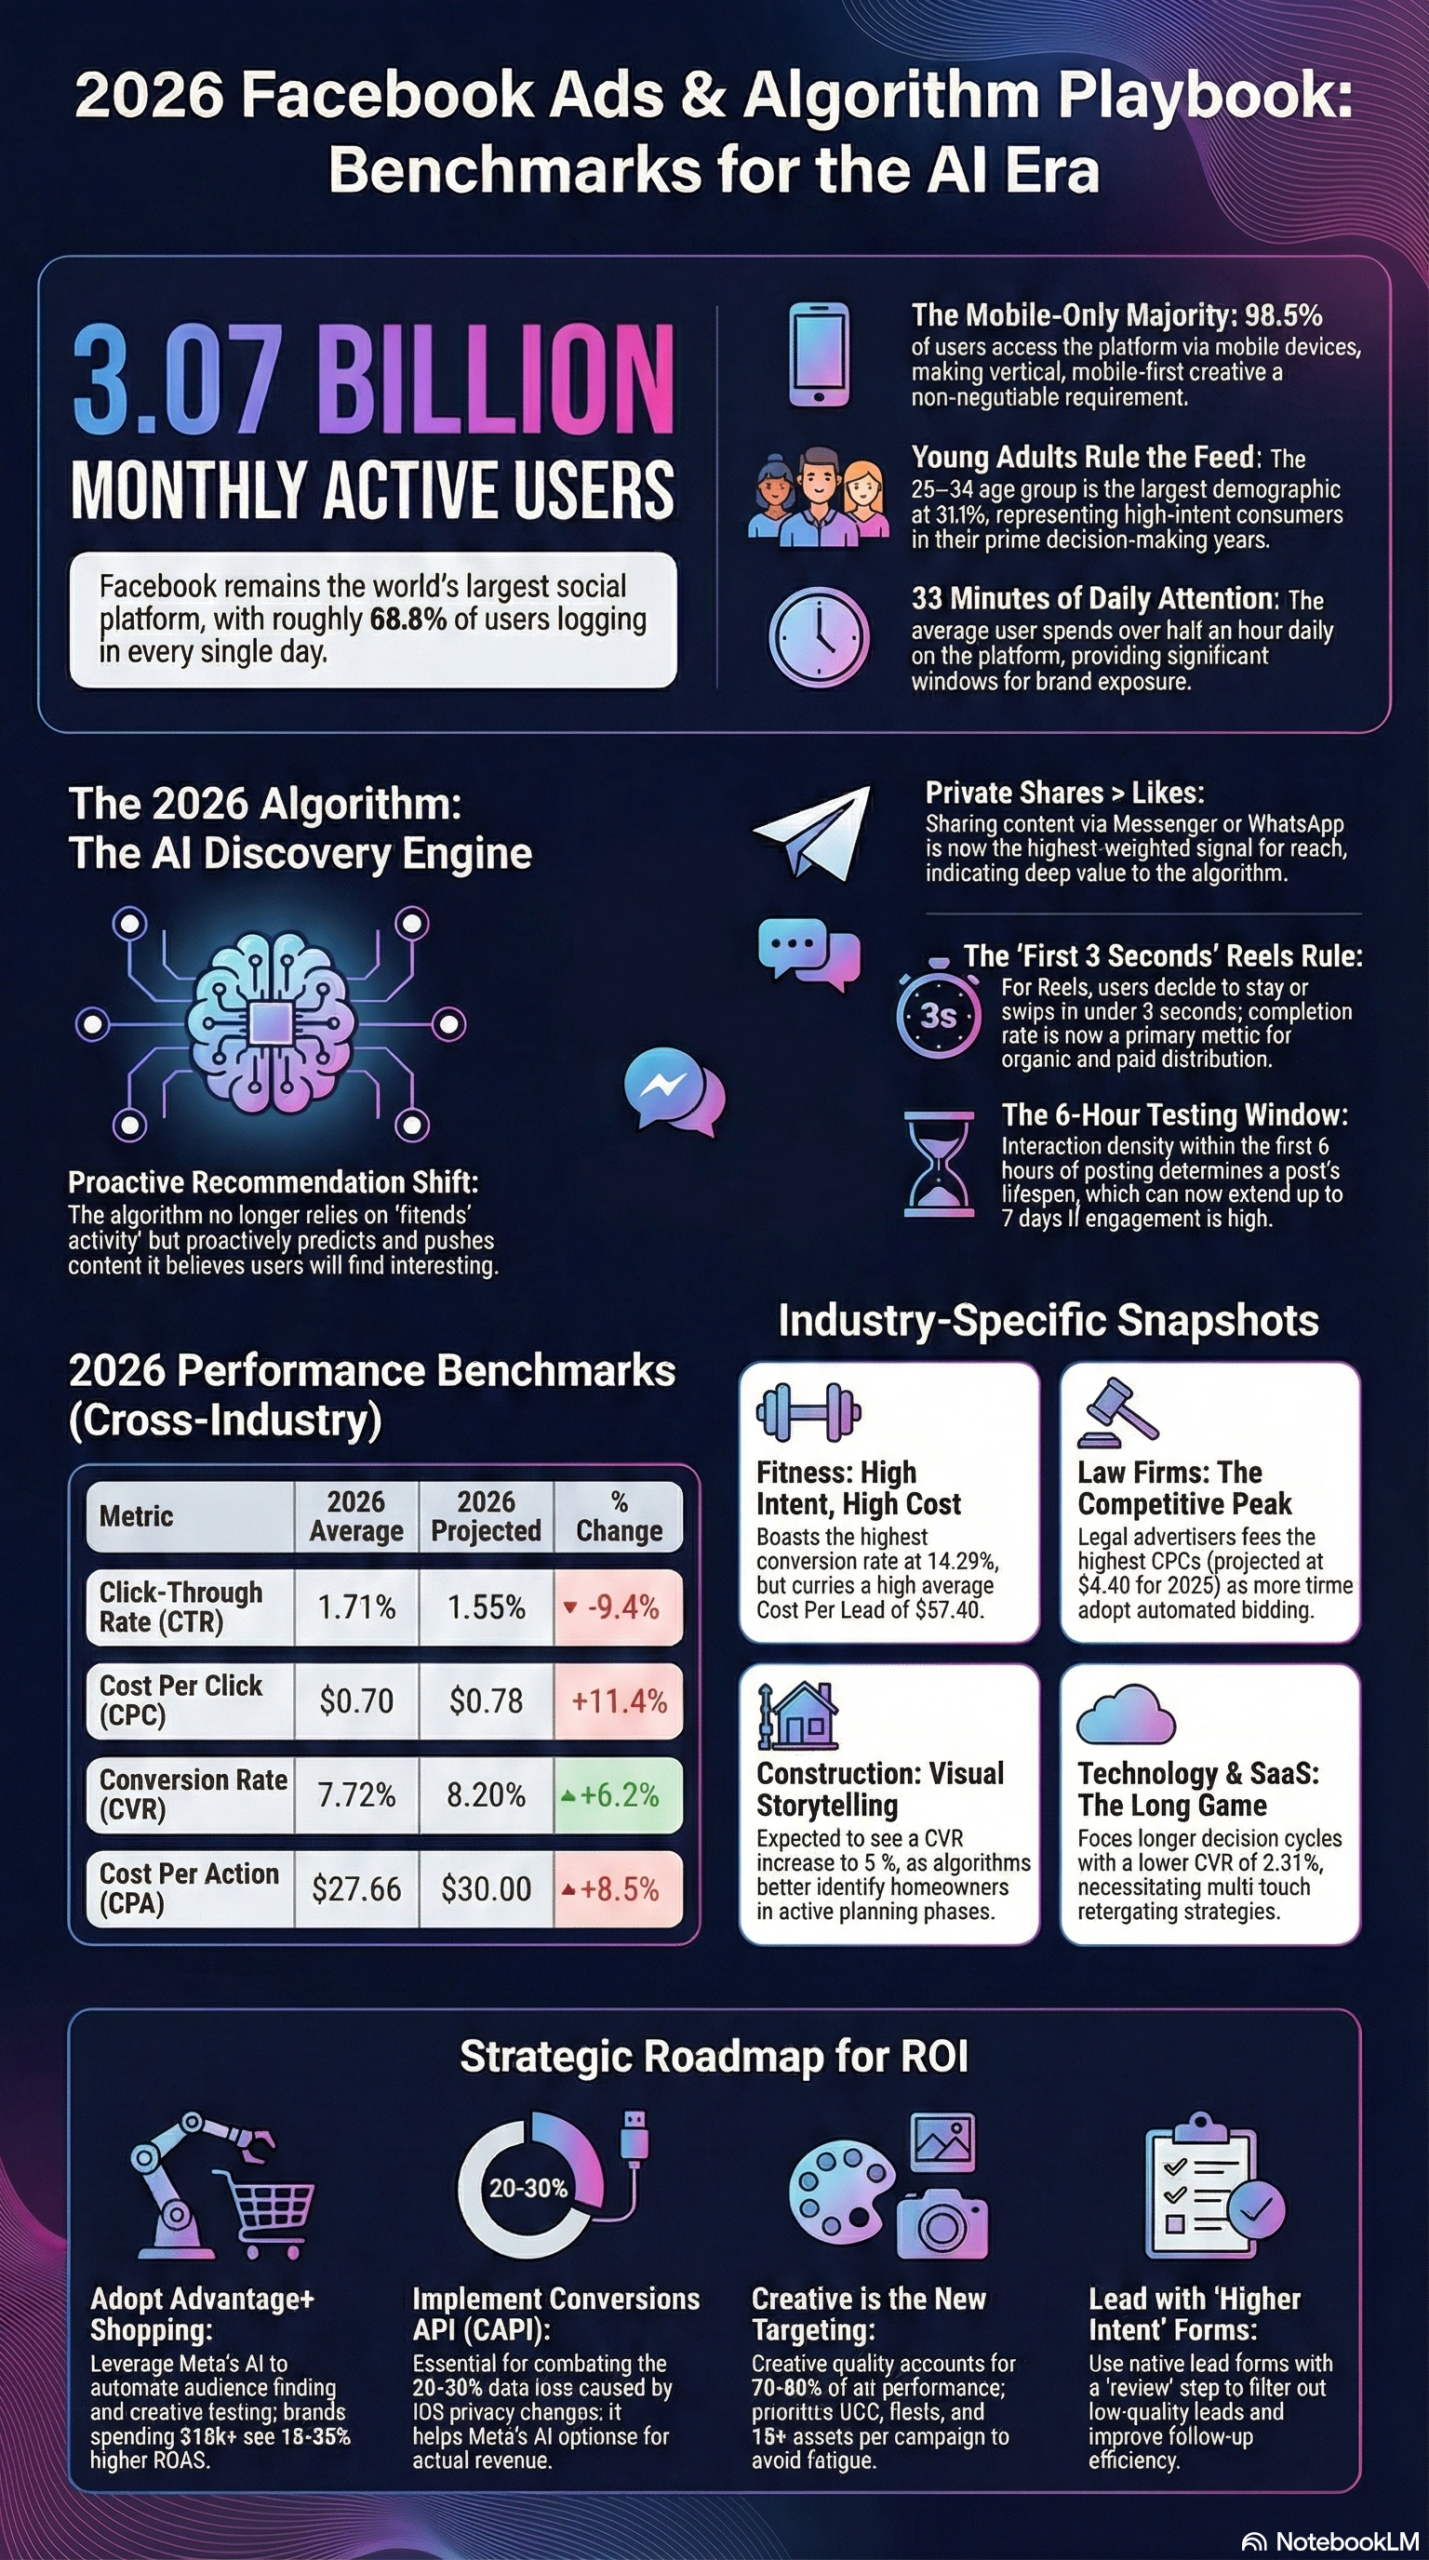
Facebook now connects 3.07 billion monthly active users and facilitates 2 billion daily interactions — but raw reach means nothing if you’re targeting the wrong slice of that audience. This tutorial walks you through every major demographic signal available in 2026, shows you exactly how to map those signals to campaign structure, and gives you the targeting and creative playbook to act on what the data actually says.
What This Is
The annual Facebook demographics snapshot is more than a slide deck stat — it’s a targeting brief. Hootsuite’s 2026 Facebook Demographics report compiles platform-level user data across age, gender, geography, device, and usage behavior, synthesized alongside Meta’s own performance benchmarks to give practitioners a current-state picture of who is actually on the platform and how they behave.
Understanding the demographics is foundational to using Meta Ads effectively. The platform’s 2026 algorithmic paradigm shift has moved Facebook from a “friend-feed” model to an AI-driven discovery engine — more than 50% of News Feed content now comes from accounts users do not follow. That means the algorithm is actively deciding whom your ad reaches beyond your stated targeting. If you don’t understand the composition of the platform, you can’t interpret whether that expansion is working for or against you.
Here’s what the demographics tell us structurally. The core adult user base (25–54) represents the dominant, commercially active segment. The 25–34 cohort is the single largest age bracket at 24.2% of users, followed by 35–44 at 19% and 45–54 at 14.2%, per Hootsuite’s 2026 data. These are not passive lurkers — 54% of adults aged 50–64 visit the platform daily, and 71% of all U.S. adults use Facebook. The idea that Facebook has “aged out” of relevance is simply not supported by the numbers.
The gender distribution sits at 56.6% male and 43% female globally, but that aggregate masks important behavioral splits. Female users over-index on news consumption: 43% of female Facebook users get news from the platform compared to 32% of males. Meanwhile, Messenger skews female at 54.6% — relevant for anyone running click-to-Messenger campaigns. Geographically, India leads all countries at 403 million users, the U.S. holds 197 million+ (representing 45% of all U.S. social media site visits), and 81%+ of the UK population uses Facebook.
One cohort that demands special attention: Generation Alpha (born 2010–2024). Despite Facebook’s 13+ age policy, 50% of Gen Alpha start using social media before age 12. They already influence $300 billion in family spending, and while their primary platforms are YouTube (43%) and TikTok (21%), understanding where this cohort will migrate as they age into Facebook’s primary demographic window is a forward-looking advantage for brands in education, gaming, and consumer goods.
Device behavior is critical for creative decisions. Contrary to the assumption of total mobile dominance, the current desktop/mobile traffic split sits at 50.97% desktop vs. 49.03% mobile. However, Android users average 17 hours and 17 minutes per month in the app and open it 280 times per month. That near-equal split means you cannot design for mobile-only and ignore desktop — especially for B2B audiences where desktop purchase behavior remains strong.
Why It Matters
Demographics data determines how you allocate budget, structure creative, and sequence your funnel. Three structural shifts in 2026 make this year’s demographic read more consequential than past years.
The AI audience expansion effect. Meta’s Advantage+ targeting now treats your demographic inputs as “suggestions” rather than hard constraints. The algorithm will expand reach beyond your stated audience if it identifies performance opportunity elsewhere. If your creative is designed for a 25–34 female segment but the algorithm expands to 45–54 males and your messaging doesn’t land there, you’ll see your CPA inflate with no obvious diagnostic signal. Knowing the platform’s actual demographic composition helps you design creative that works across the expansion zones, not just your primary target.
Consumer spending is stratifying. Per the 2026 Facebook Ecosystem Briefing, GDP growth is currently sustained by high-income households — their spending grew 2.6% year-over-year in late 2025, while middle and low-income spending grew only 1.6% and 0.6% respectively. If your product targets price-sensitive demographics, you’re competing for a shrinking spending share. Practitioners need to calibrate offer positioning and price anchoring to their specific demographic segment’s economic reality.
Teen dropout changes the funnel. Only 31% of U.S. teens use Facebook compared to 92% for YouTube. For brands that depend on early-stage brand imprinting with younger audiences, Facebook is a retention and conversion platform, not a discovery platform for the under-25 cohort. That changes where Facebook sits in your full-funnel architecture — you’re likely converting or retargeting people who first encountered you elsewhere.
For agencies, the actionable implication is clear: Facebook is the highest-ROI platform for mid-career, economically active adults (25–54), particularly in sectors with high purchase intent like Fitness (14.29% CVR), Education (13.58%), and Healthcare (11%), per 2026 benchmark data. For DTC brands, the desktop/mobile split means two distinct creative tracks are not optional.
The Data: Facebook Demographics at a Glance
Age and Gender Breakdown (2026)
| Age Group | % of Users | Daily Visit Rate | Primary Behavior |
|---|---|---|---|
| 18–24 | ~18% | Moderate | Video consumption, Reels |
| 25–34 | 24.2% | High | Discovery, purchases, Messenger |
| 35–44 | 19% | High | News, groups, marketplace |
| 45–54 | 14.2% | Very high (54% daily) | News, video, community |
| 55–64 | ~13% | Very high | News, family groups |
| 65+ | ~11% | High | Family, news |
Source: Hootsuite Facebook Demographics 2026
Cross-Industry Ad Performance Benchmarks (2025–2026)
| Metric | 2025 Average | 2026 Projected | Change |
|---|---|---|---|
| Click-Through Rate (CTR) | 1.71% | 1.55% | -9.4% |
| Cost Per Click (CPC) | $0.70 | $0.78 | +11.4% |
| Conversion Rate (CVR) | 7.72% | 8.2% | +6.2% |
| Cost Per Action (CPA) | $27.66 | $30.00 | +8.5% |
Source: 2026 Facebook Ecosystem Briefing / NotebookLM Research Report
Top-Converting Industries (2026 CVR)
| Industry | Conversion Rate | Avg CPA | Notes |
|---|---|---|---|
| Fitness | 14.29% | ~$15–20 | Mobile-first, high urgency |
| Education | 13.58% | <$29 | Lead forms, intent-driven |
| Employment & Training | 11.73% | Low | Cheaper clicks vs. Google |
| Healthcare | 11.00% | Moderate | Telehealth convenience |
| Technology | 2.31% | ~$55.21 | Long decision cycles |
| Hardware/Automotive | 0.37% | High | Research-heavy |
Source: 2026 Facebook Ecosystem Briefing
Step-by-Step Tutorial: Building a Demographics-Driven Facebook Campaign in 2026
This is how you translate demographic intelligence into a campaign that actually performs. Follow these phases in order.
Phase 1: Map Your Product to the Demographic Reality
Before opening Ads Manager, answer three questions using the demographic data:
Who is the platform’s dominant paying cohort? For 2026, that’s 25–54 year olds who skew slightly male globally but are near-parity in the U.S. This cohort has stable income, purchase authority, and daily platform habits.
Where does your product’s CVR ceiling sit? If you’re in Education or Fitness, you’re operating in a high-conversion category and can afford to bid more aggressively. If you’re in Technology or Automotive, you’re in a research phase — lead capture and retargeting will outperform hard conversion campaigns on first touch.
What device does your buyer use? Given the 50.97% desktop / 49.03% mobile split, pull your existing website analytics and identify the device split for converted customers specifically. If your converters skew desktop, prioritize 1.91:1 creative ratios alongside mobile 9:16. If they skew mobile, prioritize 4:5 feed and 9:16 Reels.
Phase 2: Set Up CAPI Before You Spend a Dollar
This is non-negotiable in 2026. iOS privacy changes have caused 20–30% data loss in pixel-only setups, meaning Meta’s AI bidding tools are operating on incomplete signal. The Conversions API (CAPI) sends server-side event data directly to Meta, bypassing browser-level privacy restrictions.
Step 1: In your Meta Business Manager, navigate to Events Manager > Datasets.
Step 2: Select your pixel dataset and click Settings > Conversions API.
Step 3: Choose your integration method:
– Direct API integration (developers): Use Meta’s CAPI documentation to implement server-side POST requests for Purchase, Lead, and ViewContent events.
– Partner integration (non-developers): Connect via Shopify, WooCommerce, HubSpot, or your CRM directly from the Events Manager interface.
Step 4: Enable Event Match Quality monitoring. Target a match quality score of 6.0 or higher — this ensures Meta can tie server events back to specific users and feed accurate data to the algorithm.
Step 5: Implement deduplication parameters (event_id) to prevent the same conversion from being counted twice (once from the browser pixel, once from CAPI).
Without this, any demographic targeting you configure is being fed to an AI that’s working with corrupted input data.
Phase 3: Build Your Audience Architecture
With 2026’s Advantage+ system, targeting strategy has fundamentally changed. Per the 2026 Facebook Ecosystem Briefing, Meta’s official guidance is to treat detailed interest targeting as suggestions, not constraints. Here’s how to structure this correctly:
Restrictions (use sparingly):
– Age minimum if legally required (e.g., 21+ for alcohol, 18+ for financial products)
– Geography if your product only serves specific markets
– That’s it. Do not add more restrictions unless legally mandated.
Suggestions (use freely, but don’t over-specify):
– Lookalike Audiences built from your best customer list (top 25% by LTV)
– Custom Audiences from your website pixel (30-day, 60-day, 180-day windows)
– Interest targeting based on 3–5 broad categories relevant to your product
What NOT to do: Do not create separate ad sets for each demographic segment (e.g., one for 25–34, one for 35–44). Per the 2026 Ecosystem Briefing, “The biggest mistake you can make is to treat detailed targeting suggestions as tight constraints. Do not create separate ad sets based on different detailed targeting inputs.” The algorithm will find the same people regardless, and you’ll fragment your budget, preventing each campaign from exiting the Learning Phase.
Phase 4: Structure Your Campaign for Algorithm Learning
The Facebook algorithm requires a Learning Phase to optimize delivery — typically 5–12 days. For it to exit learning efficiently, your campaign needs 50 conversions per ad set per week.
Recommended structure for 2026:
- 1–3 Advantage+ Shopping Campaigns (for DTC/eCommerce) with daily budgets of $100+
- 1 Lead Generation Campaign using Higher Intent Instant Forms (with a review step to filter low-quality leads)
- 1 Retargeting Campaign targeting pixel visitors from the past 30–60 days
Consolidate budgets rather than spreading across many small campaigns. Brands spending $10K+ monthly that use Advantage+ Shopping Campaigns see 15–25% higher ROAS by letting Meta optimize creative and placement automatically.
Phase 5: Create Demographics-Informed Creative
Creative quality now accounts for up to 56% of campaign performance variance — more than targeting does. Use your demographic knowledge to brief your creative team correctly:
For the 25–44 segment (your highest-volume buyer):
– Use authentic, UGC-style video. In Fitness and Real Estate, phone-recorded testimonials increase CVR by up to 300% versus studio-produced content.
– Implement the 3-second hook rule for Reels. The algorithm scores Reels on completion rate, not clicks. If users don’t stay past 3 seconds, the algorithm stops distributing the ad.
– Format: 9:16 for Stories/Reels, 4:5 for Feed. With 98.5% of usage mobile, vertical-first is mandatory.
For the 45–64 segment (your highest daily visit rate):
– Lead with trust signals: testimonials, credentials, guarantees.
– This cohort over-indexes on news consumption — editorial-style copy in carousels and link-preview formats performs well.
– Desktop-format creative matters more here: this cohort uses desktop at higher rates than younger users.
Video reach currently exceeds photo reach by 135% across all demographics. If you’re still running static images as your primary ad format in 2026, you’re operating at a structural disadvantage.
Phase 6: Implement Speed-to-Lead Systems
This applies specifically to lead generation campaigns. Per 2026 benchmark data, leads contacted within 5 minutes are nine times more likely to convert. If your sales team is calling leads 24–48 hours later, your Facebook demographics data can be perfect and your campaign will still underperform.
Implementation:
1. Connect your Meta Lead Ad forms to your CRM via Zapier, native integration, or Meta’s CRM partners (Salesforce, HubSpot, etc.)
2. Set up immediate email/SMS sequences that deploy on form submission
3. Route high-priority leads (higher intent form completions) to immediate phone follow-up queue
4. For e-commerce, ensure your retargeting pixel fires on cart abandonment and your abandoned cart email sequence launches within 30 minutes
Phase 7: Monitor and Interpret
Key metrics to watch through a demographics lens:
- Frequency by demographic segment: If frequency exceeds 4.0 for a specific age cohort in your audience, creative fatigue is likely the cause of performance decline.
- Cost per Result by placement: Monitor Feed vs. Reels vs. Stories separately. Your 45–54 segment may convert better on Feed; your 25–34 segment may convert better on Reels.
- Audience Overlap: Check for overlap between ad sets to avoid self-competition.
Expected outcomes at the end of a properly structured 30-day campaign: A well-executed Advantage+ campaign in Education or Fitness targeting the 25–44 demographic, with CAPI implemented and vertical-first creative, should achieve CVRs in the 10–14% range with CPAs well below the Google Ads equivalent. Education advertisers specifically should expect Facebook CPAs under $29 versus $90+ on Google Search.
Real-World Use Cases
Use Case 1: E-Commerce DTC Brand (Apparel/Fitness)
Scenario: A direct-to-consumer fitness apparel brand with a $15K/month ad budget. Their primary buyer is female, 28–42, household income $75K+.
Implementation: The brand consolidates all budget into a single Advantage+ Shopping Campaign with a $500/day budget. They upload their top 500 customers as a seed audience for Lookalike generation. Creative is entirely UGC — 15-second phone-recorded try-on videos in 9:16 format. CAPI is implemented via Shopify’s native Meta integration. Age restriction is set to 21+ to prevent budget waste on teen traffic that doesn’t convert.
Expected Outcome: Given Fitness’s 14.29% CVR benchmark, a $500/day spend generating 50+ weekly conversions exits Learning Phase within 7 days. ROAS of 3.5–4.5x is achievable within 30 days based on Advantage+ benchmark data.
Use Case 2: Online Education Platform (Lead Generation)
Scenario: An online certification program targeting career-changers aged 30–50 in the U.S. and Canada.
Implementation: The platform runs a Lead Generation campaign using Higher Intent Instant Forms (with review step) targeting broad demographics with a 1% Lookalike from their enrolled student list. Creative is carousel-format showing student outcome data (salary increases, job placements). The form asks for name, email, current job title, and desired field. All form submissions route to HubSpot via Zapier, triggering a 3-email sequence within 90 minutes.
Expected Outcome: Education’s 13.58% CVR and sub-$29 average CPA versus Google’s $90+ make Facebook the obvious primary acquisition channel. Higher Intent forms reduce volume by 20–30% but increase lead quality enough to improve downstream enrollment rates by a larger margin.
Use Case 3: Local Healthcare / Telehealth Practice
Scenario: A telehealth provider targeting adults 35–64 across 5 U.S. states, emphasizing convenience and insurance acceptance.
Implementation: Campaign structure: one Awareness campaign (video showing the telehealth experience) and one Conversion campaign targeting website visitors from the past 60 days. Geographic targeting is restricted to the 5 operating states — one of the legitimate restriction use cases. Creative emphasizes trust signals: provider credentials, response time guarantees, insurance logos. Desktop-format creative is included given the higher desktop usage in the 45–64 cohort.
Expected Outcome: Healthcare’s 11% CVR benchmark applies to this scenario. The retargeting layer should convert at 2–3x the cold audience rate. Expect CPAs in the $25–40 range depending on state-level competition.
Use Case 4: B2B SaaS (Technology Sector)
Scenario: A project management SaaS targeting operations managers at companies with 50–500 employees.
Implementation: This is the hardest case on Facebook given Technology’s 2.31% CVR and ~$55 CPA. The correct approach is a two-stage funnel: Stage 1 is a content-first Lead Magnet campaign (free ROI calculator, benchmark report) targeting job title and industry. Stage 2 retargets lead magnet downloaders with a demo offer. Budget should be heavily weighted to Stage 1 (70/30 split). Creative is primarily carousel and static — this audience researches on desktop and responds to data-forward copy.
Expected Outcome: Direct demo conversion rates will be low (2–4%) but cost-per-qualified-lead will be competitive. The real optimization lever is the Stage 1 to Stage 2 conversion rate — track this explicitly.
Use Case 5: Recruitment / Employment Advertising
Scenario: A staffing agency recruiting for healthcare roles (nurses, technicians) in a tight labor market.
Implementation: Employment & Training’s 11.73% CVR makes it one of the most efficient Facebook categories. Given the 47.5% healthcare share of all U.S. job growth in 2025, there is genuine demand. Campaigns target 25–54 age range broadly with job title exclusions (exclude currently employed full-time in the target role). Creative is straightforward: salary range, location, apply-now CTA. Higher Intent forms pre-screen for licensure.
Expected Outcome: Click costs in Employment are lower than most categories. Expect CPAs well below $30 for qualified applicants in healthcare, with Higher Intent forms filtering candidates to only those with active interest in switching.
Common Pitfalls
1. Over-segmenting audiences into too many ad sets.
The most common structural mistake. Splitting one campaign into 6 ad sets by age group, interest, and location fragments your budget below the Learning Phase threshold (50 conversions/week per ad set). Each ad set enters an endless learning loop and never optimizes. Fix: consolidate into 1–3 ad sets per campaign, broaden targeting, and let the algorithm segment for you.
2. Running pixel-only tracking without CAPI.
With 20–30% data loss from iOS privacy restrictions, pixel-only campaigns are giving Meta’s AI corrupted inputs. The algorithm makes bidding and delivery decisions on incomplete data, which means it’s targeting the wrong people with your budget. Fix: implement CAPI via native integration or direct API before spending significant budget.
3. Ignoring the desktop/mobile creative split.
The near-50/50 desktop/mobile traffic split means mobile-only creative leaves half your potential impressions with a suboptimal experience. This is especially costly for the 45–64 demographic, which over-indexes on desktop. Fix: always include 1.91:1 (desktop feed) and 4:5 (mobile feed) alongside 9:16 (Stories/Reels).
4. Treating teens as a Facebook audience.
Only 31% of U.S. teens use Facebook. If your product targets under-25 audiences, Facebook is not the discovery platform for that cohort — YouTube and TikTok are. Directing budget toward Facebook for teen-skewing products will show poor reach and inflated CPMs. Fix: reposition Facebook as a conversion and retargeting platform for your 25+ audience.
5. Slow lead follow-up.
Leads contacted within 5 minutes are nine times more likely to convert. A 24-hour follow-up window wastes the campaign’s investment. Fix: automate initial contact via CRM workflows and reserve human follow-up for qualified responses.
Expert Tips
1. Use Private Sharing as an Engagement Proxy.
The 2026 Facebook algorithm now weights private sharing (sends via Messenger/WhatsApp) as the highest engagement signal — above likes and comments. If your organic content generates DM shares, it will get significantly more algorithmic distribution. Engineer shareable content: templates, tools, comparison graphics, and surprising data points that people want to forward.
2. Build a Lookalike Seed from Top 25% LTV, Not All Customers.
Standard Lookalike audiences built from total customer lists include your worst customers. Build your seed from your highest-LTV 25% — this signals to Meta’s AI what a high-value buyer looks like, not just any buyer. Segment your CRM and export only the top quartile before uploading.
3. Test Advantage+ Creative Variations, Not Whole Campaigns.
Rather than running A/B tests at the campaign level (which requires separate budgets), upload 3–5 creative variants within a single Advantage+ ad set. Meta will automatically allocate spend toward the best-performing variant. This keeps budget consolidated and preserves Learning Phase stability.
4. Set Higher Intent Instant Forms for Finance and Real Estate.
In categories where lead quality matters more than lead volume, the Higher Intent form’s review step (which shows the user their answers before submitting) reduces junk submissions by 20–30%. The 2026 Ecosystem Briefing specifically calls this out for Real Estate and Finance where a low-quality lead has a hard cost attached to it.
5. Monitor Event Match Quality Weekly.
After CAPI implementation, log into Events Manager weekly to check your Event Match Quality score. Scores below 6.0 indicate that server-side events aren’t matching to Facebook user profiles reliably, which degrades bidding performance. Common causes: missing or hashed user data fields (email, phone, first/last name) not being passed with the event. Add all available match key parameters to your CAPI calls.
FAQ
Q: Is Facebook still worth advertising on in 2026 given TikTok’s growth?
Yes — for any demographic 25 and above. 71% of U.S. adults use Facebook, and its conversion benchmarks in sectors like Fitness (14.29%), Education (13.58%), and Healthcare (11%) are difficult to match on other platforms. The platform’s weakness is under-25 reach, where only 31% of teens are active. Use Facebook for conversion and retention; use TikTok or YouTube for discovery with younger cohorts.
Q: How do I know if my Advantage+ campaign is expanding to the wrong audience?
Run a demographic breakdown report in Ads Manager under Breakdown > Delivery > Age and Gender on your active campaign. Compare the served demographics to your intended audience. If you’re seeing significant spend going to age groups or genders with high CPA relative to your core audience, add an Age Restriction (not just a suggestion) to constrain delivery. This is one of the few legitimate uses of hard targeting restrictions.
Q: What budget do I need to exit the Learning Phase?
The Learning Phase requires 50 optimization events per ad set per week. If you’re optimizing for Purchase and your CVR from click to purchase is 5%, you need 1,000 clicks per week to hit 50 conversions. At a $0.78 average CPC, that’s roughly $780/week or ~$112/day. For lead generation with higher CVRs, the threshold is easier to hit. Consolidating budget into fewer ad sets is the fastest path to exiting Learning.
Q: Should I exclude existing customers from prospecting campaigns?
Yes, in most cases. Upload your customer list as a Custom Audience exclusion on your prospecting campaigns. The exception is if you sell consumable products with high repeat-purchase rates — in that case, serving acquisition-focused ads to existing customers just adds noise. For high-consideration purchases (software, big-ticket items), re-engaging existing customers is better handled via a separate retention campaign with a distinct offer.
Q: How important is video creative in 2026, really?
Video reach exceeds photo reach by 135% on Facebook. The algorithm’s completion-rate scoring for Reels means high-quality video doesn’t just perform better — it distributes differently. A video with a 60%+ completion rate will be pushed to a significantly larger audience than a static image with equivalent engagement. If you’re not producing video, you’re competing at a structural disadvantage. UGC video (phone-shot, authentic) consistently outperforms studio production in most consumer categories.
Bottom Line
The 2026 Facebook demographic picture is clear: the platform remains the dominant channel for commercially active adults aged 25–54, with particularly strong conversion performance in Fitness, Education, Healthcare, and Employment. The 3.07 billion monthly active user base isn’t going anywhere, but the mechanics of reaching them have fundamentally changed — AI-driven audience expansion, Advantage+ consolidation, and CAPI-dependent tracking are the non-negotiable table stakes for 2026 campaign performance. Practitioners who map their product to the correct demographic segment, implement clean server-side tracking, consolidate campaign structure, and lead with video creative will consistently outperform those still operating on 2020-era segmentation logic. The data is available, the tools are documented, and the playbook is here — execute it.


0 Comments