

Traffic is climbing. Campaigns are running. The brand is visible. Yet qualified pipeline stays flat and revenue won’t budge — a pattern that has become one of the most common and most expensive problems in modern marketing organizations. The culprit is almost never the campaigns themselves; it’s the disconnected MarTech infrastructure underneath them. This tutorial walks through exactly how to diagnose a broken MarTech system, rebuild the data foundation using a Customer Data Platform (CDP), apply the right machine learning models for your specific revenue goals, and close the gap between traffic and actual revenue.
What This Is: The MarTech Revenue Leak Problem
The phenomenon has a clinical name in the research: structural revenue leakage. It happens when a marketing organization scales its activity — more ads, more content, more email sends — without scaling the underlying data infrastructure that connects those activities to revenue outcomes. According to the Strategic Briefing on CDPs and AI-Driven Growth (NotebookLM Research, 2026), the core architectural failure is a fragmented identity graph — different tools holding different, incompatible versions of who a customer actually is.
Here is what that fragmentation looks like in practice. A prospect visits your pricing page three times in a week. Your analytics platform records those sessions. Your marketing automation tool fires a nurture sequence tagged to a different email address the prospect used for a whitepaper download six months ago. Your CRM has a third record with the prospect’s work email from a trade show scan. None of these three systems talk to each other. To your sales team, this person looks cold. To your paid media tool, they look like a brand-new prospect eligible for top-of-funnel retargeting. Meanwhile, they were two questions away from buying.
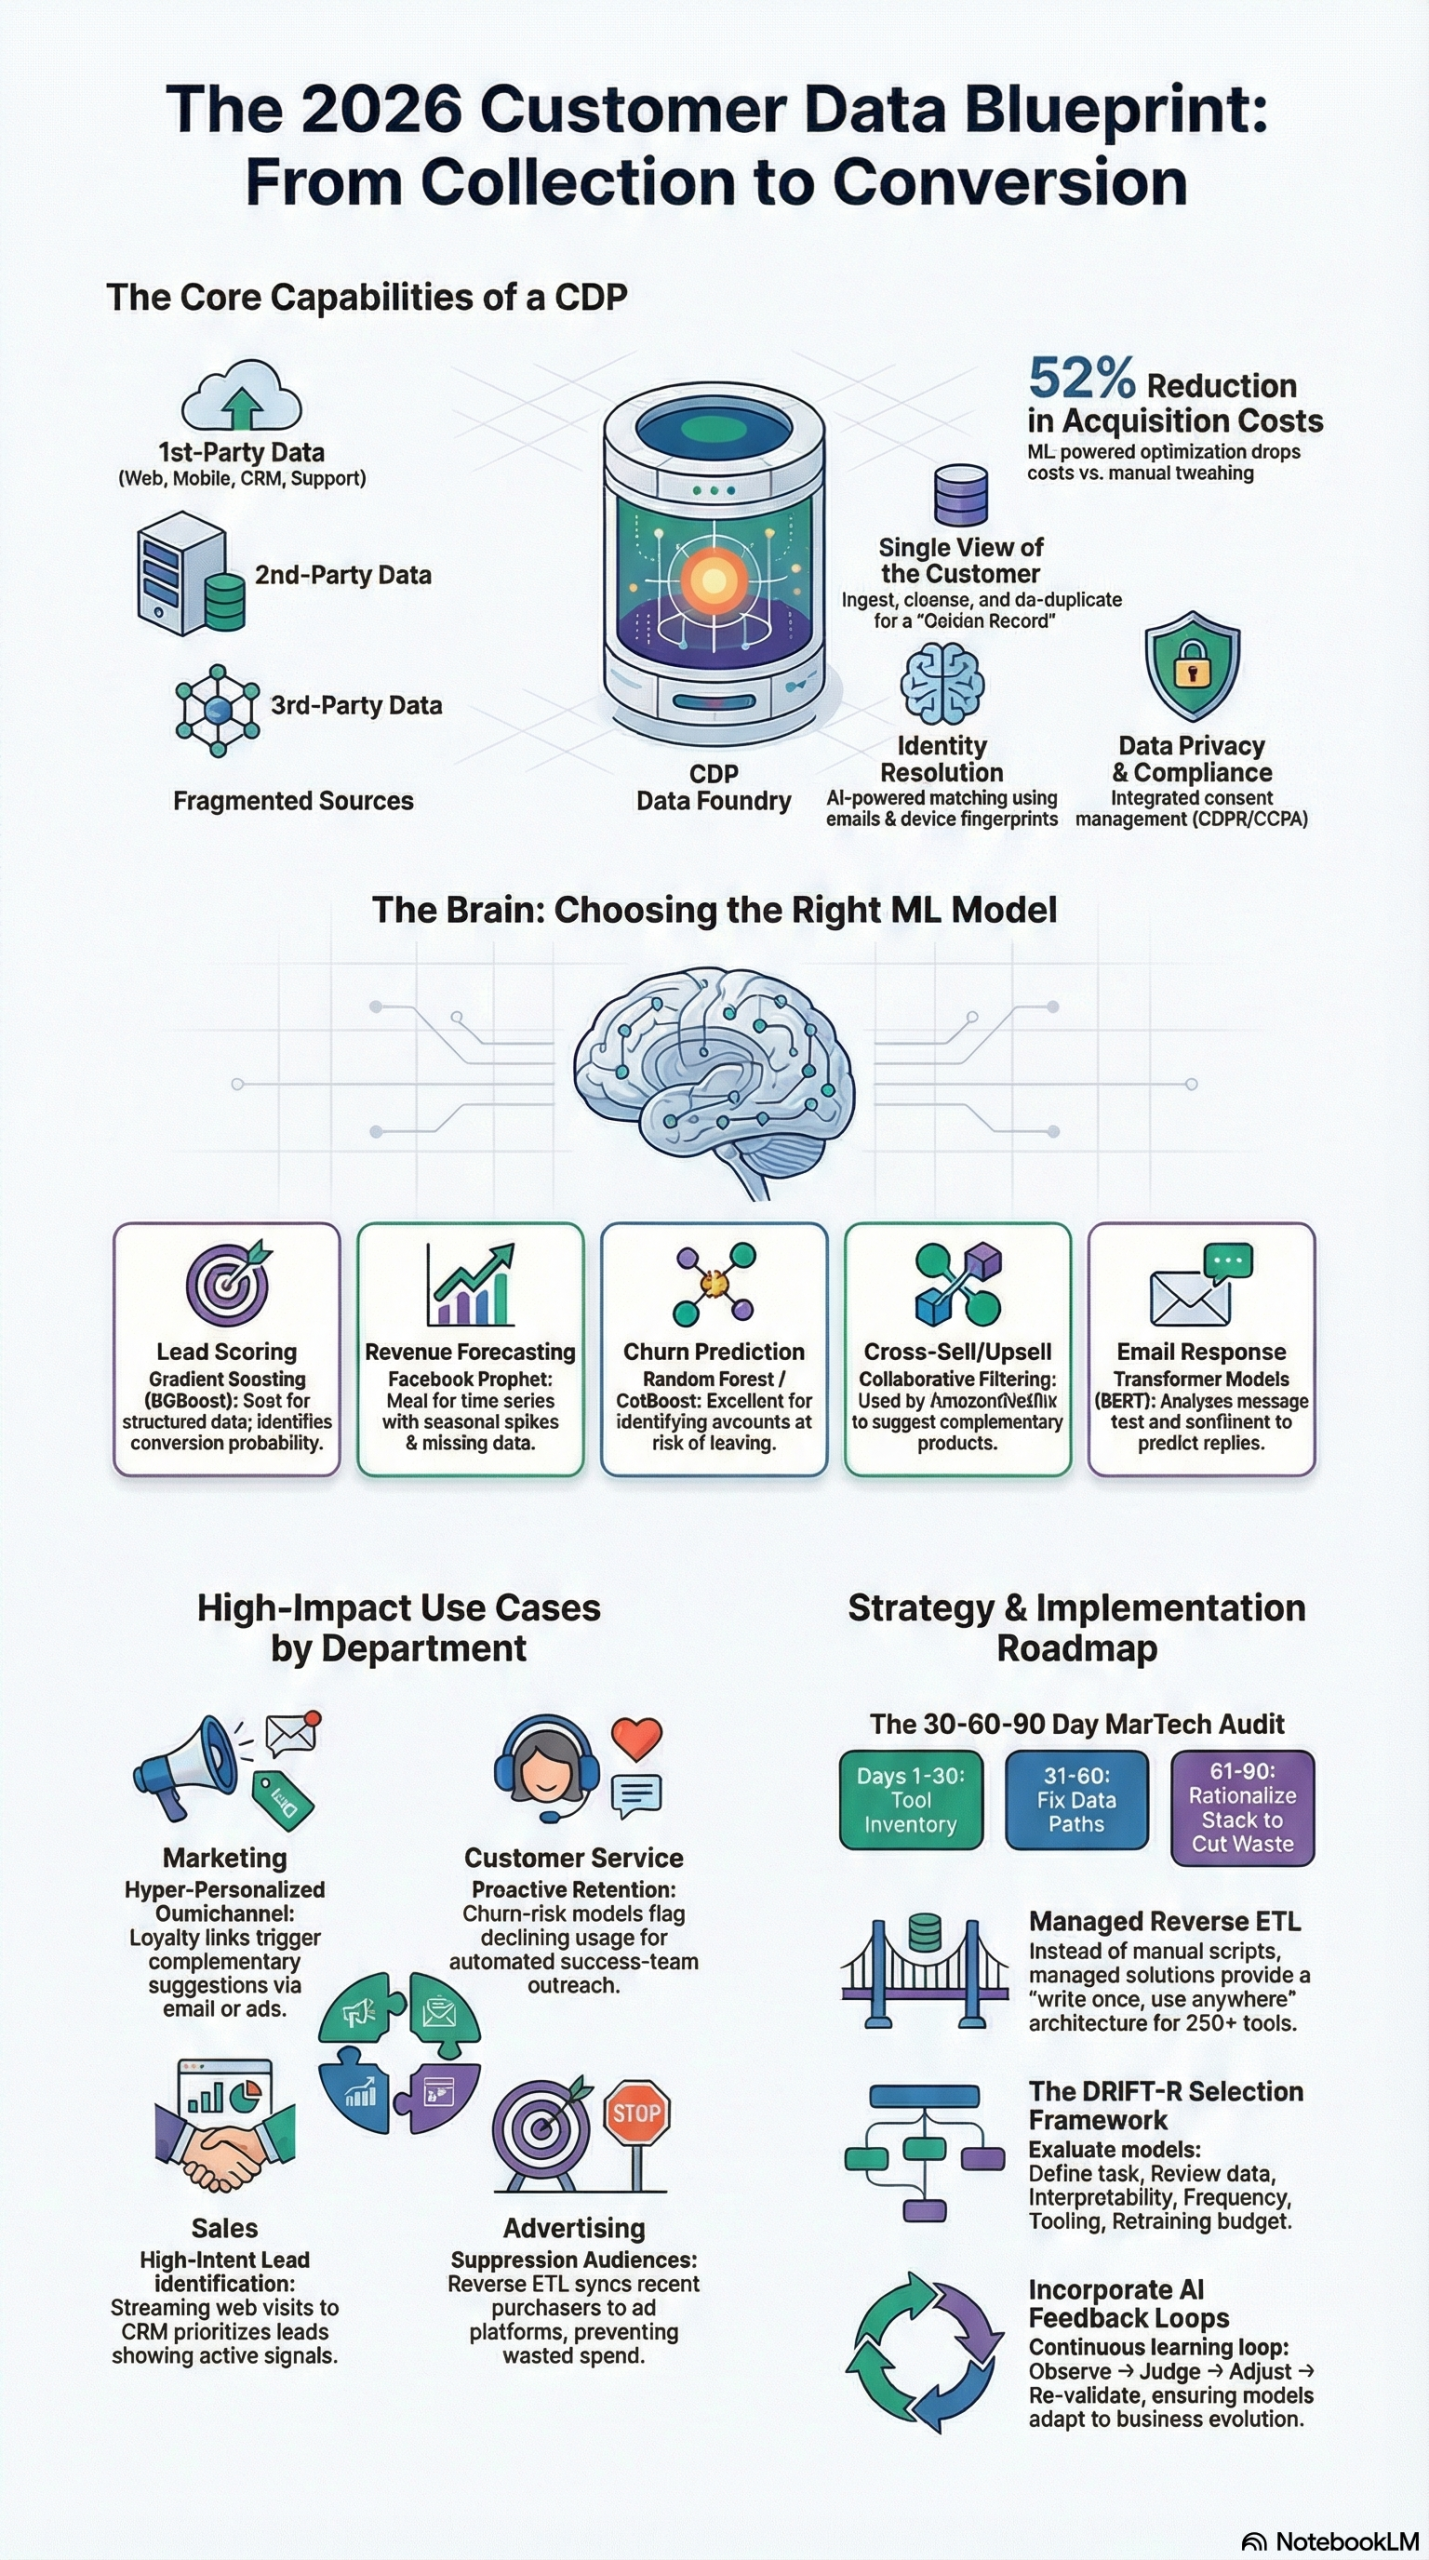
The research report describes the foundational solution as the Customer Data Platform (CDP) — a system that has, by 2026, evolved far beyond its origins as a marketing data repository. Modern CDPs now function as what the research calls “the system of record and context for first-party customer intelligence.” That means they ingest raw behavioral data (page views, mobile events, form completions, support tickets) from every channel, resolve those signals to a single persistent customer profile, and then distribute enriched, analytics-ready data back to every operational tool in your stack via a process called Reverse ETL.
The Reverse ETL piece is especially important for breaking revenue stagnation. Traditional data flows move data from source systems into a warehouse for analysis. Reverse ETL flips that direction: cleaned, enriched, scored customer data flows from your warehouse back into Salesforce, HubSpot, or whatever CRM and ad platform your revenue teams actually use. As the research report notes, this is the “last mile” of analytics — the moment when a lead score or purchase propensity score stops being a number in a dashboard and starts being a piece of information that changes how a sales rep prioritizes their morning.
The distinction between a CDP and a CRM matters here. A CRM stores manually entered sales and service interactions — what happened in a meeting, what a rep typed into a notes field. A CDP ingests raw behavioral data and builds a continuous, machine-updated view of the customer. The two systems are complements, not competitors. The problem most organizations have is treating the CRM as the system of record for customer intelligence when it’s actually a system of record for sales activity. Fixing that conceptual mismatch is step one in fixing the revenue leak.
Why It Matters: Who Gets Hurt Most by MarTech Silos
The research report frames this as an “enterprise drag” problem, but the damage is not limited to large organizations. Any company running three or more point solutions without a unified data layer is bleeding revenue at multiple points simultaneously.
Marketing teams are the most immediately affected. Without a unified profile, personalization is surface-level at best. You can merge a first name into a subject line, but you cannot adapt an email sequence based on whether this person has already seen a demo, used the free trial, and visited the pricing page twice. Lookalike audience algorithms on paid platforms also suffer: if your seed audience is polluted with existing customers or low-intent browsers, your CAC climbs while conversion rates stay flat.
Sales teams operate on incomplete context. A rep calling a prospect who has been deeply researching your product has a fundamentally different conversation than a rep cold-calling someone who clicked one ad. When the CRM shows both prospects as equally unqualified, the rep treats them the same. The research report documents that real-time intent scoring — surfacing signals like repeated pricing page visits or multiple logins — can increase qualified opportunities by 22%.
Customer service teams face the same problem in reverse. Without access to a unified purchase and behavior history, support agents cannot route tickets intelligently or personalize resolutions. Average handling time stays high. First-contact resolution rates stay low.
The financial stakes are not abstract. The research report cites an annual cost of $3 trillion associated with bad data in the U.S. economy. Organizations that implement AI-powered CDPs correctly report up to a 52% reduction in customer acquisition costs and a 25% increase in conversion rates. These are not marketing projections — they are the documented outcomes of fixing the data infrastructure that most organizations already have but have not yet connected properly.
The shift the research describes as Agentic Marketing — systems that not only analyze data but plan and execute multi-step tasks autonomously — is only possible once this data foundation is in place. Without unified, clean, real-time customer data, an AI agent making campaign decisions is making them blind.
The Data: MarTech Fragmentation vs. Unified CDP Architecture
The following table compares the operational reality of a siloed MarTech stack against one built around a unified CDP, based on the research report’s analysis of functional outcomes across departments.
| Dimension | Fragmented MarTech Stack | CDP-Unified Architecture |
|---|---|---|
| Customer Identity | Multiple partial records across tools | Single persistent profile with deterministic + probabilistic resolution |
| Lead Scoring | Manual or rules-based in CRM only | ML-powered, real-time, synced to all tools via Reverse ETL |
| Paid Media Audiences | Built from platform-native pixels | First-party segments synced server-to-server, suppressing existing customers |
| Sales Context | CRM shows activity; no behavioral signals | Rep sees intent score, page views, feature usage, and purchase history |
| Personalization Depth | First name merge, basic segments | Hyper-personalized omnichannel based on behavioral micro-segments |
| Attribution | Last-click or first-click in one platform | Multi-touch across all channels from unified event stream |
| Data Privacy Compliance | Inconsistent consent across tools | Consent management integrated at CDP layer, propagated to all channels |
| Customer Acquisition Cost | Baseline | Up to 52% reduction documented |
| Conversion Rate | Baseline | Up to 25% increase documented |
| Engineering Overhead | High — custom API integrations per tool | Reduced via managed Reverse ETL; data team focuses on modeling |
Machine Learning Model Selection by Revenue Function
The research report makes a critical point that is often glossed over in CDP vendor marketing: model selection is not one-size-fits-all. The wrong model for your specific revenue task produces what the research calls “illusions” rather than intelligence — scores and predictions that feel sophisticated but misclassify leads and generate inaccurate forecasts.
| Model Type | Best Revenue Use Case | Key Consideration |
|---|---|---|
| Random Forest | Lead scoring & qualification | Robust with smaller datasets; surfaces key conversion drivers |
| XGBoost / Gradient Boosted Machines | Complex attribution & pattern recognition | Excels at non-linear relationships in large datasets |
| Neural Networks | Advanced behavioral prediction & deep personalization | Requires 10,000+ interactions/month to be reliable |
| Prophet (Facebook) | Sales and revenue forecasting | Handles missing data and seasonal spikes better than LSTMs in low-data scenarios |
| BERT / Transformers | Email response prediction | Analyzes message text and sentiment to predict prospect engagement |
Step-by-Step Tutorial: Rebuilding Your MarTech Stack Around Revenue
This tutorial follows the implementation sequence recommended in the research report: start narrow, prove ROI, then expand. Do not attempt to unify everything at once. You will fail, burn out your data team, and convince leadership that CDPs don’t work.
Phase 1: Audit Your Current Stack (Days 1–5)
Step 1: Map where truth lives.
Pull a list of every tool in your stack that holds customer or prospect data. This includes your CRM, marketing automation platform, analytics tool, ad platforms, customer support software, product analytics, and any data warehouse. For each tool, answer three questions:
– What customer identifier does this tool use as its primary key? (email, user ID, cookie, phone number?)
– Does this tool receive data from other tools, send data to other tools, or neither?
– When a customer updates their email address, does this tool update automatically or stay stale?
You are mapping your identity graph — or more accurately, you are mapping the multiple incompatible identity graphs that currently coexist in your stack.
Step 2: Identify your highest-value data gap.
Look for the single gap that is costing you the most revenue right now. Common candidates:
– Paid media waste: Are you paying to advertise to existing customers or recently-churned accounts? This is often the fastest ROI fix.
– Unscored high-intent leads: Do pricing page visitors or trial users get treated identically to cold traffic in your CRM?
– Cart or checkout abandonment: Do you have behavioral event data showing incomplete purchases that never trigger a recovery workflow?
Pick one. This is your pilot use case.
Phase 2: Select and Implement a CDP (Days 6–30)
Step 3: Choose the right CDP tier for your data volume.
Not every organization needs an enterprise CDP. Match the tool to your current data volume and team capacity:
– < 50K monthly active profiles: A mid-market CDP (e.g., Segment, RudderStack) with a managed connector to your warehouse will cover most use cases.
– 50K–500K profiles: Look for CDPs with native identity resolution and Reverse ETL built in, or pair a warehouse-native CDP with a Reverse ETL tool like Census or Hightouch.
– 500K+ profiles: Enterprise CDPs with real-time streaming, AI-powered identity graphs, and server-to-server ad platform integrations become worth the investment.
Step 4: Define your unified profile schema before you ingest anything.
This is where most implementations fail. Teams connect their first data source and start ingesting immediately, then discover six months later that their CRM uses email as a field name, their product analytics tool uses user_email, and their support tool uses contact_email. The CDP creates three separate fields and never merges them.
Before connecting any source, define your canonical schema:
unified_customer_id: string (internal UUID)
email: string (primary deterministic identifier)
phone: string (secondary deterministic identifier)
anonymous_id: string (cookie/device ID for pre-identification)
account_id: string (B2B company linkage)
first_seen_at: timestamp
last_active_at: timestamp
lifecycle_stage: enum [visitor, lead, mql, sql, customer, churned]
intent_score: float (0.0–1.0, updated by ML model)
Map every source field to this schema before ingestion begins.
Step 5: Implement deterministic and probabilistic identity resolution.
According to the research report, AI-powered identity resolution uses both deterministic identifiers (known emails, account IDs) and probabilistic signals (device fingerprints, browsing paths) to merge anonymous behavior with known profiles.
Configure your CDP to:
1. Create an anonymous profile on first page view, linked to a cookie/device ID.
2. Merge the anonymous profile to a known profile on email capture (form fill, login, checkout).
3. Apply probabilistic matching rules for edge cases: same device ID + same IP + similar behavioral pattern = likely same person, flag for review.
4. Set a minimum confidence threshold (typically 85%+) before auto-merging profiles to avoid false positives.
Phase 3: Select and Deploy Your ML Model (Days 30–60)
Step 6: Apply the DRIFT-R Framework to choose your first model.
The research report outlines a six-factor decision framework specifically for revenue-focused ML implementation. Work through each dimension before selecting a model:
- D — Define task type: Is this a classification problem (will this lead convert: yes/no?) or a regression problem (how much will this account spend in the next 90 days?)
- R — Review available data: How many labeled examples do you have? If fewer than 5,000 historical conversions, avoid neural networks. Start with Random Forest.
- I — Interpretability needs: Does your sales team need to see why a lead received a score of 87? If yes, tree-based models (Random Forest, XGBoost) give you feature importance scores. Neural networks do not.
- F — Frequency of prediction: Does the score need to update in real-time as a prospect browses, or is a nightly batch re-score sufficient? Real-time scoring requires a streaming pipeline; batch scoring is far simpler to implement.
- T — Tooling fit: Does your selected model integrate with your CRM’s scoring fields? Salesforce Einstein and HubSpot both have native ML scoring, but they require specific input formats.
- R — Retraining budget: How often can your team update and validate the model? If your data volume is low, quarterly retraining with manual review is more reliable than automated weekly retraining.
Step 7: Build your lead scoring pipeline for the pilot use case.
For a standard B2B lead scoring implementation using Random Forest:
# Simplified lead scoring pipeline
import pandas as pd
from sklearn.ensemble import RandomForestClassifier
from sklearn.model_selection import train_test_split
from sklearn.metrics import roc_auc_score

# Load unified profile data from warehouse
df = pd.read_sql("""
    SELECT
        pricing_page_views,
        feature_page_views,
        email_opens_last_30d,
        trial_started,
        company_size_tier,
        industry_code,
        days_since_first_visit,
        converted  -- label: 1 = became SQL, 0 = did not
    FROM unified_customer_profiles
    WHERE created_at >= '2025-01-01'
""", conn)

# Features and label
X = df.drop('converted', axis=1)
y = df['converted']

# Train/test split
X_train, X_test, y_train, y_test = train_test_split(
    X, y, test_size=0.2, random_state=42
)

# Train model
model = RandomForestClassifier(n_estimators=200, max_depth=8, random_state=42)
model.fit(X_train, y_train)

# Evaluate
auc = roc_auc_score(y_test, model.predict_proba(X_test)[:,1])
print(f"AUC-ROC: {auc:.3f}")  # Target: > 0.75 before deploying

# Feature importance — show your sales team what drives the score
importance_df = pd.DataFrame({
    'feature': X.columns,
    'importance': model.feature_importances_
}).sort_values('importance', ascending=False)
print(importance_df)
Run this pipeline nightly. Export scores to your warehouse. Use Reverse ETL to sync the intent_score field directly into your CRM’s lead scoring field.
Phase 4: Close the Loop with Reverse ETL (Days 60–90)
Step 8: Configure Reverse ETL to push scored data into operational tools.
Select a managed Reverse ETL tool (Census, Hightouch, or a native CDP feature) and configure syncs for:
– CRM (Salesforce/HubSpot): Sync intent_score, lifecycle_stage, pricing_page_views to Contact/Lead fields. Update on every model run.
– Paid media platforms: Sync lifecycle_stage = customer as a suppression audience to Facebook, Google, and LinkedIn via server-to-server API. This prevents paying to advertise to people who already bought.
– Marketing automation: Sync intent_score > 0.75 as a dynamic segment that triggers high-touch sales sequences.
– Customer support: Sync account_health_score and last_purchase_date to support ticket context fields.
Step 9: Implement consent management at the CDP layer.
As third-party cookies continue their phase-out, every personalization and ad targeting decision must flow through a consent-aware data layer. Configure your CDP to:
1. Ingest consent events from your Consent Management Platform (CMP) as a data source.
2. Tag each profile with their current consent state (marketing, analytics, personalization).
3. Filter all downstream audiences and syncs by consent state before data leaves the CDP.
Expected Outcome After 90 Days: A functioning pilot with measurable results. Paid media suppression of existing customers typically shows CAC reduction within the first campaign cycle (2–4 weeks). Lead scoring ROI shows in the SQL pipeline within 30–60 days as reps prioritize high-score leads. Track these metrics weekly and present to leadership before expanding the implementation.
Real-World Use Cases
Use Case 1: SaaS Company Reducing Paid CAC with Customer Suppression
Scenario: A B2B SaaS company is running LinkedIn and Google ads targeting its ICP (ideal customer profile). Roughly 15% of ad spend is reaching existing customers and recently churned accounts — invisible waste because the ad platforms have no way to know who has already purchased.
Implementation: Connect the CRM to the CDP. Define a suppression_audience segment: all contacts where lifecycle_stage = customer OR churned_within_90d. Configure a Reverse ETL sync to push this segment to LinkedIn Matched Audiences and Google Customer Match via server-to-server API, updated daily.
Expected Outcome: 10–20% reduction in wasted ad spend within the first campaign cycle. Improved audience quality signals for the ad platform’s lookalike algorithms, which tend to compound over 4–6 weeks.
Use Case 2: E-commerce Brand Recovering Cart Abandonment Revenue
Scenario: A mid-market e-commerce brand sees 68% cart abandonment but only 12% recovery rate from existing email sequences. The sequences are triggered by the email marketing tool, but the timing and content are not informed by behavioral context from the product analytics tool.
Implementation: Connect product analytics events (cart_item_added, checkout_started, checkout_abandoned) to the CDP. Build a real-time segment: checkout_abandoned AND NOT purchase_completed AND email_consent = true. Trigger a personalized recovery sequence that includes the specific product abandoned, the price, and — for high-intent profiles with pricing_page_views > 2 — a time-limited discount offer.
Expected Outcome: Recovery rate improvement of 5–15 percentage points, depending on offer strength and timing. The key is that the recovery offer is calibrated to intent signals, not sent uniformly.
Use Case 3: B2B Sales Team Prioritizing High-Intent Inbound Leads
Scenario: A sales team of 12 reps handles 300+ inbound leads per month from content downloads, webinar registrations, and demo requests. All leads enter the CRM at the same priority level. Reps spend equal time on a CFO who visited the pricing page five times and a student downloading a whitepaper for a class project.
Implementation: Deploy the Random Forest lead scoring pipeline described in the tutorial. Sync intent_score to the CRM. Configure a view for reps that surfaces only leads with intent_score > 0.70 in a high-priority queue. Add feature importance annotations in the CRM record so reps know why the score is high (e.g., “Pricing page: 5 visits, Trial started: Yes, Company size: Enterprise”).
Expected Outcome: Based on the research report, real-time intent scoring can increase qualified opportunities by 22%. More importantly, reps stop burning time on unqualified leads and have better conversations with qualified ones.
Use Case 4: Content-Heavy Media Brand Monetizing Newsletter Audience
Scenario: A B2C media company has 400,000 newsletter subscribers but flat display ad revenue and poor performance on promoted product offers. The email platform knows open and click rates. The website analytics knows what content topics drive the most engagement. These two datasets have never been connected.
Implementation: Connect the email platform and web analytics to a CDP using email as the shared identifier. Build behavioral topic affinity segments: cluster subscribers by their top 3 content categories based on click behavior. Use these segments to personalize promoted product placements in the newsletter (matching financial product offers to the finance-topic cluster, for example). Sync segments to ad platforms for monetization partnerships.
Expected Outcome: Higher CPMs for audience-matched advertising packages. Improved click rates on promoted offers due to relevance alignment rather than batch-and-blast distribution.
Common Pitfalls
Pitfall 1: Trying to Unify Everything on Day One
Organizations that attempt full-stack data unification as an initial project almost always stall. The scope becomes political — every team wants their tool to be the “source of truth” — and the data quality work becomes overwhelming. The research report is explicit: start with a single, “simple, executable” pilot with measurable ROI. Prove one use case. Then expand.
Pitfall 2: Choosing the Wrong ML Model for Your Data Volume
Deploying a neural network on 2,000 historical conversions produces a model that overfits to noise. The research report identifies this as building “illusions” rather than intelligence. Before selecting a model, count your labeled training examples. Under 5,000: use Random Forest. Under 500: use rules-based scoring until you accumulate more data. Neural networks require 10,000+ interactions per month to be reliable.
Pitfall 3: Treating Integration as Infrastructure, Not a Product
Pipelines break. Schema changes in upstream tools silently corrupt downstream data. The research report notes that organizations must treat integration flows “as products with clear owners and measurable service levels.” Assign a named owner to every integration. Set up data quality monitors that alert when record counts drop below expected thresholds or when key fields start arriving null.
Pitfall 4: Ignoring the Consent Layer
Syncing customer data to ad platforms without respect for consent preferences creates both brand risk and legal liability under GDPR, CCPA, and other privacy regulations. Configure consent state as a mandatory filter on every Reverse ETL sync. A suppression audience sent to an ad platform should only include profiles with ad_consent = true.
Pitfall 5: Skipping Model Retraining
A lead scoring model trained on last year’s data will decay in performance as market conditions, product positioning, and buyer behavior change. The research report frames AI deployment as a circular workflow requiring continuous feedback loops — signal collection, evaluation against quality standards, and targeted improvements. Schedule quarterly model retraining reviews at minimum, and monitor AUC-ROC scores monthly to detect performance degradation before it affects pipeline quality.
Expert Tips
1. Use Feature Importance to Coach Sales, Not Just Score Leads. When you deploy a tree-based model (Random Forest or XGBoost), you get feature importance scores as a free output. Share these with your sales team. If “pricing page views” and “trial activation” are the top two predictors of conversion, your reps now know what questions to ask and what behaviors to look for in their own outreach.
2. Build Suppression Audiences Before Expansion Audiences. The fastest ROI in a CDP implementation is almost always removing existing customers and churned accounts from acquisition campaigns. Do this first, before building any lookalike or expansion audience. It’s faster to implement, produces clear results within one campaign cycle, and builds stakeholder trust in the CDP investment.
3. Standardize Your Event Taxonomy Before Connecting Sources. Define a company-wide event naming convention before you ingest your first behavioral event. The standard format is object_action — product_viewed, checkout_started, subscription_cancelled. Once you have 50+ events named inconsistently across three tools, retroactive cleanup becomes a months-long project.
4. Test Reverse ETL with a Read-Only Audit First. Before your first Reverse ETL sync pushes data into your production CRM, run it in audit mode: output the sync results to a staging table and review 50–100 records manually. Verify that the right profiles are being matched, that no existing CRM data is being overwritten incorrectly, and that the field mappings are accurate. One bad sync can corrupt thousands of CRM records.
5. Apply the DRIFT-R Framework to Every New Model Request. When a stakeholder asks for “an AI model to predict churn” or “a model to score accounts,” run through DRIFT-R before writing a single line of code. More than half the time, working through Interpretability needs and Retraining budget reveals that a simpler rules-based approach will deliver 80% of the value with 20% of the complexity — and that’s the right answer.
FAQ
Q: Do I need a separate CDP, or can my CRM or marketing automation platform handle this?
Modern CRMs and marketing automation platforms have added CDP-adjacent features, but they have a structural limitation: they were built to store records that humans update, not to ingest high-volume behavioral event streams and resolve identity probabilistically. A dedicated CDP or warehouse-native CDP layer is necessary if you need real-time behavioral data — page views, app events, support interactions — unified at the profile level. If your use case is limited to email open/click data and CRM activity, your existing tools may be sufficient.
Q: How much historical data do I need before ML-powered lead scoring adds value?
The research report and the DRIFT-R framework point to a practical minimum of 5,000 labeled conversion events (leads that became customers vs. leads that did not) before a Random Forest model outperforms well-designed rules-based scoring. Below that threshold, invest your data team’s time in data quality and collection. The model will be more valuable once you have the volume.
Q: What is Reverse ETL, and is it different from a CDP?
Reverse ETL is a data movement pattern, not a platform category. It describes the process of syncing data from a warehouse or CDP to operational tools like CRMs, ad platforms, and customer support software. A CDP can include Reverse ETL functionality, or you can use a dedicated Reverse ETL tool (Census, Hightouch) alongside a warehouse-native CDP. The research report describes Reverse ETL as putting “analytics-ready data directly into the hands of business users” — it’s the last mile that converts analysis into action.
Q: How do I handle the transition away from third-party cookies in my paid media strategy?
The research report recommends delivering first-party segments directly to ad platforms via server-to-server APIs rather than relying on pixel-based cookie tracking. Connect your CDP to Facebook’s Conversions API, Google’s Enhanced Conversions, and LinkedIn’s Insight Tag server-side equivalent. This requires a CDP or customer data infrastructure that can manage server-side event streams, but it insulates your targeting and measurement from browser-level privacy changes.
Q: How often should I retrain my ML models?
There is no universal answer — it depends on how fast your market and product change. The research report frames this as a “retraining budget” question: how much engineering and data science time can you realistically allocate to model updates? A practical starting point is quarterly retraining with monthly performance monitoring (tracking AUC-ROC or precision/recall against a holdout set). If you see a sustained 10%+ drop in model accuracy over 4–6 weeks, retrain immediately rather than waiting for the quarterly cycle.
Bottom Line
More traffic with flat revenue is not a campaign problem — it is a data infrastructure problem. The research report documents clearly that the gap between marketing activity and revenue outcomes is caused by fragmented identity graphs, mismatched ML models, and operational tools that never receive the enriched data sitting in your warehouse. The fix is architectural: implement a CDP as your system of record for first-party customer intelligence, choose ML models matched to your actual data volume and interpretability requirements using the DRIFT-R framework, and close the last mile with Reverse ETL so that lead scores and intent signals reach the people making revenue decisions. Organizations that execute this correctly are documenting 52% reductions in customer acquisition costs and 25% conversion rate improvements — not from spending more on campaigns, but from making existing data work harder. The era of Agentic Marketing — AI systems that plan and execute multi-step revenue tasks autonomously — is only available to organizations that have laid this foundation first.


0 Comments