OpenSnow’s PEAKS model — launched December 5, 2025 — is the clearest proof yet that a small, domain-obsessed team can out-forecast government-funded weather agencies on their own turf. By combining a U-Net neural network with 45 years of historical storm data and 38 dynamic atmospheric variables, PEAKS downscales standard 10–25 km global model grids to a 3 km (1.8-mile) resolution purpose-built for mountains. This tutorial breaks down exactly how PEAKS works, how to put it to use for ski trip planning or mountain operations, and what OpenSnow’s technical roadmap tells the rest of us about building hyper-specialized AI forecasting tools.
What This Is: OpenSnow and the PEAKS AI Model
OpenSnow is an independent weather platform founded in 2011 by meteorologist Joel Gratz and partner Bryan Allegretto — both, as the name implies, passionate skiers who had lived the frustration of bad snow forecasts firsthand. According to the NotebookLM research report, the company started as a manual data-entry operation where forecasters literally hand-keyed snow reports into the system. Fifteen years later, it runs one of the most technically sophisticated weather platforms aimed at outdoor recreationists anywhere on the internet.
PEAKS is the engine underneath. The acronym stands for the model’s goal: precision elevation-aware knowledge synthesis (the technical name is less important than what it does). It is built on a U-Net neural network architecture — the same class of convolutional network originally developed for biomedical image segmentation, here repurposed to take a “blurry” low-resolution weather image and sharpen it into something mountain-accurate.
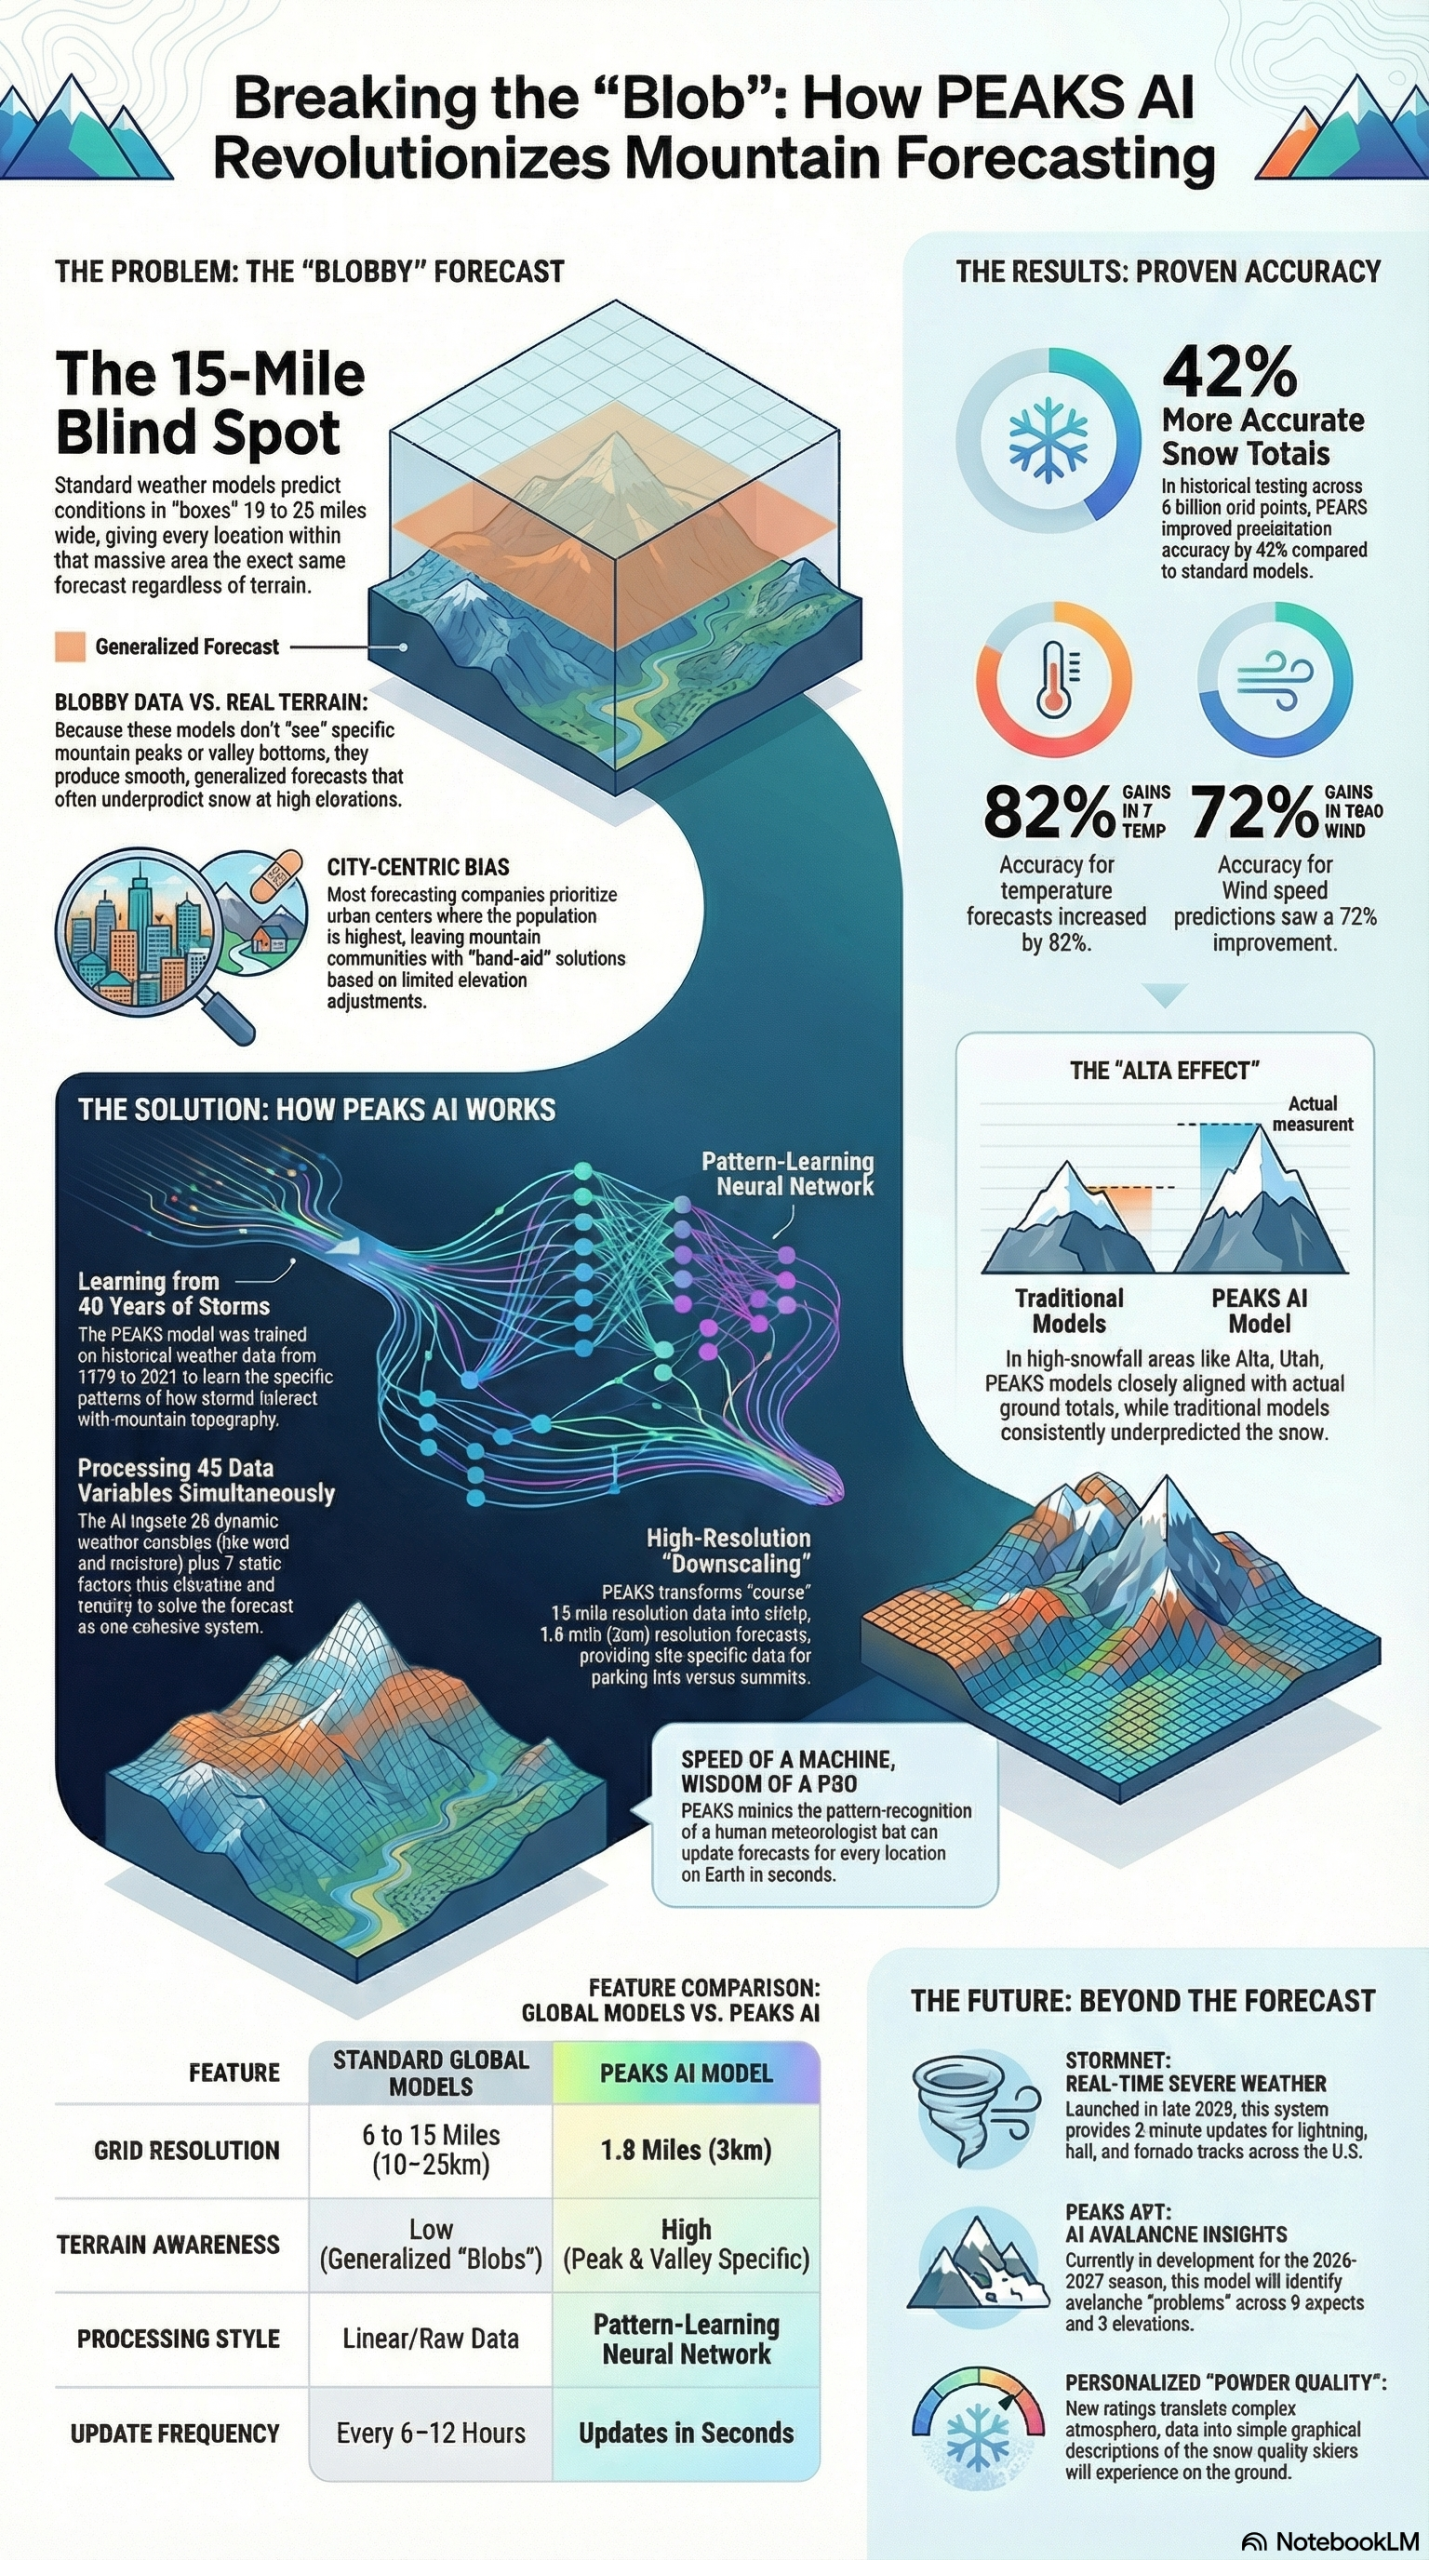
Here is the core problem PEAKS solves: standard global weather models like the GFS (Global Forecast System) or the European ECMWF operate on grid cells 10 to 25 kilometers wide. In flat terrain — Kansas, the Netherlands, the Canadian prairies — that resolution is workable. But in the Rockies, the Alps, or the Cascades, conditions can shift dramatically over a single kilometer of elevation gain. A 25 km grid cell that spans the base of a ski resort to its summit ridge averages those conditions into a single value, producing what OpenSnow partner Bryan Allegretto describes as a forecast that is “blob-y” and smooth, as it does not understand the location of each mountain peak and valley bottom.
PEAKS was trained on historical storm data spanning 1979 to 2021 — 42 years of atmospheric records — to learn exactly where and how the standard models fail. The training dataset was evaluated across 6 billion grid points, teaching the model to recognize the systematic errors that occur when a broad grid encounters complex terrain. During inference, PEAKS ingests 38 dynamic weather variables (things like 500 mb pressure, 850 mb temperature, column-integrated moisture, geopotential height) alongside 7 static factors that never change: topography, elevation bands, slope aspect, land-water masks, and related terrain descriptors. The static layer is the key differentiator — it means the model “knows” the shape of each mountain the way a local forecaster does, not the way a satellite looks down at it from 36,000 feet.
The output is a forecast grid at 3 km (1.8 mile) horizontal resolution. That is roughly an 8× improvement over the coarser end of standard models, and it has produced measurable accuracy gains across every core forecast variable tested. At Alta, Utah — one of the best-instrumented snow measurement sites in North America — standard models consistently underpredict snowfall because the model grid does not “see” the terrain funneling orographic lift into the Wasatch ridgeline. According to the research report, PEAKS closes that elevation gap, aligning closely with actual recorded precipitation totals at the site.
OpenSnow currently runs a team of 11 full-time employees plus contract forecasters. The human forecasters still write contextual narrative summaries and flag anomalous model behavior — but PEAKS handles the computationally heavy processing that would have taken a full forecast team hours to run manually.
Why It Matters: The Practitioner Case for Hyper-Local AI Forecasting
If you operate in any domain where location-specific weather drives decisions — ski resort operations, backcountry guiding, avalanche forecasting, mountain search and rescue, outdoor event planning, or even agricultural operations in complex terrain — the gap between a standard 10–25 km model forecast and a 3 km one is not academic. It is the difference between a profitable powder weekend and a slow one, between sending a guided group into the backcountry and holding them at the trailhead.
OpenSnow’s move to a subscription model in 2021 validates the commercial case. According to the research report, the company expected to lose up to 90% of their audience when they moved from ad-supported free access to paid subscriptions. Instead, traffic and retention rates reached what the report describes as industry-leading levels. Users who depend on accurate mountain forecasts proved willing to pay for measurably better data. That is a market signal worth noting for anyone building specialty AI tools: depth beats breadth when your target user has a real operational need.
For marketers and content strategists, PEAKS is a case study in how a niche product can become a dominant platform by out-specializing incumbents. OpenSnow does not try to be Weather.com. It goes deeper on one thing — mountains — than any general-purpose weather service can afford to.
For AI practitioners and data scientists, PEAKS is a canonical example of AI downscaling and bias correction applied to geospatial data. The technique — using a neural network to upsample low-resolution model output using high-resolution terrain priors — is directly applicable to domains beyond meteorology: flood modeling, wildfire spread prediction, urban heat island mapping, and agricultural micro-climate forecasting.
For mountain operations professionals, the practical impact is this: you no longer have to mentally correct for a model that doesn’t understand your terrain. PEAKS does that correction automatically, and the accuracy numbers on precipitation, temperature, and wind speed are strong enough to act on.
The Data: PEAKS Accuracy vs. Traditional Global Models
The following table summarizes accuracy improvements measured by Mean Squared Error (MSE) reduction when PEAKS forecasts are compared against traditional global weather model outputs across 6 billion historical grid points, as reported in the OpenSnow research briefing.
| Forecast Variable | Traditional Model Baseline | PEAKS Improvement (MSE Reduction) | Notes |
|---|---|---|---|
| Precipitation | 10–25 km grid | +42% | Most impactful for powder forecast reliability |
| Temperature | 10–25 km grid | +82% | Critical for snow/rain boundary prediction |
| Wind Speed | 10–25 km grid | +72% | Key for ridgeline and summit exposure assessment |
| Spatial Resolution | 10–25 km cells | 3 km cells | ~8× finer than coarser global models |
| Update Frequency | Every 6–12 hours | Near-real-time | AI inference runs in seconds vs. hours |
For comparison, here is how PEAKS sits alongside other platforms in the mountain forecasting landscape:
| Platform | Resolution | Mountain-Specific Training | AI/ML Layer | Avalanche Forecast | Subscription |
|---|---|---|---|---|---|
| OpenSnow / PEAKS | 3 km | Yes (1979–2021 data) | U-Net downscaling | Coming 2026–27 (PEAKS Avy) | Yes |
| GFS (NOAA) | ~13 km | No | No | No | Free |
| ECMWF (Euro) | ~9 km | No | Limited | No | Licensed |
| Windy.com | ~9–13 km | No | No | No | Freemium |
| Mountain-Forecast.com | ~1.5 km (WRF) | Partial | No | No | Freemium |
Sources: OpenSnow research briefing; MIT Technology Review.
Step-by-Step Tutorial: Using OpenSnow and PEAKS for Mountain Operations Planning
This walkthrough is structured for three audiences: recreational skiers planning trips, backcountry guides building a daily briefing workflow, and operations teams at ski resorts or outdoor organizations integrating forecast data into decision-making pipelines. The same PEAKS data serves all three — it is a question of how deeply you query it.
Prerequisites
- An active OpenSnow subscription (required for full PEAKS access as of 2025)
- A target mountain or resort location
- For backcountry or operations use: access to your regional avalanche center’s forecast alongside OpenSnow data (PEAKS Avy is not yet live as of March 2026)
- Optional: a spreadsheet or notes app to log forecast accuracy vs. actual conditions — this builds your own local intuition layer on top of the model
Phase 1: Orienting to the PEAKS Forecast Layer
Step 1: Select Your Location at Elevation, Not Base
This is the single most common mistake with any mountain forecast tool. When you search for a ski resort or trailhead, make sure you are viewing the forecast for the summit or upper mountain elevation zone, not the base lodge. PEAKS produces location-specific output at 3 km resolution, which means a resort with 2,000 feet of vertical relief will show meaningfully different precipitation and temperature values between its base and its top. Open the elevation selector and anchor your primary forecast view to the zone where you will actually be skiing or operating.
Step 2: Understand the Powder Quality Rating
In 2025, OpenSnow introduced a Powder Quality feature that converts raw forecast data into a textual and graphical description of expected snow texture, as documented in the research report. This is not just a marketing label — it is a computed output that accounts for temperature at time of snowfall, wind loading (which densifies snow), and the age of the snowpack surface. For recreational planning, treat a “high powder quality” rating as a meaningful signal. For operations teams, dig into the underlying temperature and wind speed variables that feed it — those are the PEAKS outputs you actually want to track.
Step 3: Read the Conditions Summary
Also introduced in 2025, the Conditions Summary is an AI-generated written description of the likely mountain experience for skiers based on the forecast data. Read it as a quick sanity check, not as the full picture. If the summary says “expect wind-affected snow above treeline with good conditions in protected terrain,” that is the model’s interpretation of what the elevation-band wind speed and precipitation type data show. You can then open the raw charts to verify and make your own call.
Phase 2: Interpreting the Core PEAKS Variables
Step 4: Check Precipitation Type and Snow-Rain Boundary
The +82% improvement in temperature accuracy is what makes PEAKS particularly strong at predicting the snow-rain boundary — the elevation at which precipitation transitions from snow to rain during a storm. This is one of the most operationally critical forecast calls in mountain meteorology, and it is where standard global models are notoriously unreliable. Look at the forecast temperature at the 850 mb and 700 mb pressure levels (roughly 5,000 and 10,000 feet) for your target elevation. If PEAKS is showing 850 mb temperatures between -2°C and +2°C, treat the snow-rain line as uncertain and plan conservatively.
Step 5: Evaluate Wind Speed at Summit Elevation
With a +72% improvement over traditional models in wind speed accuracy, PEAKS gives you credible data on ridgeline and summit exposure that standard models simply cannot provide. Pay attention to directional wind relative to your specific terrain — a northeast wind on a northeast-facing cirque bowl will load that terrain heavily even during a modest storm. The 3 km resolution means PEAKS can differentiate between an exposed ridge and an adjacent protected gully in a way that a 25 km grid cannot.
Step 6: Map the Precipitation Totals to Your Known Terrain
Over time, you will develop what experienced forecasters call a “bias correction” — a mental model of how your specific terrain performs relative to what even a high-resolution model predicts. Keep a simple log: after each storm, record the PEAKS forecast snowfall total for your summit zone and compare it to the actual measured total at your snow stake or weather station. Within one to two seasons, you will know whether your peak consistently over- or under-performs the PEAKS forecast by a predictable margin. That local correction is the final mile of accuracy the model cannot provide.
Phase 3: Using StormNet for Severe Weather Awareness
Step 7: Set Up Severe Weather Alerts via StormNet
OpenSnow acquired StormNet from AtmoSphere Analytics in late 2024. According to the research report, StormNet ingests 125 million data points to produce real-time severe weather forecasts with updates every two minutes. The model predicts lightning, hail, damaging winds, and tornadoes — hazards that matter enormously for summer mountain operations, high-altitude trail running events, and any outdoor activity that runs outside the winter snow season.
For operations teams: configure StormNet alert thresholds for your geographic footprint. The two-minute update cycle makes it viable for real-time decision support — lift evacuation calls, event holds, guided party turnaround decisions. The key operational parameter is the 168-hour (7-day) severe weather lead that StormNet provides, which gives operations enough runway to adjust staffing and logistics well ahead of a threat.
Step 8: Cross-Reference with Regional Forecast Offices
StormNet and PEAKS together are powerful, but they are not replacements for your regional National Weather Service Forecast Office, especially for winter storm warnings, wind advisories, and avalanche watches that carry regulatory or liability weight. Use PEAKS as your high-resolution planning layer; use NWS products as your safety and communications anchor.
Phase 4: Preparing for PEAKS Avy (Winter 2026–2027)
Step 9: Understand What PEAKS Avy Will and Won’t Do
Scheduled for release in winter 2026–2027, PEAKS Avy is designed to automate parts of the avalanche forecasting process. According to the research report, it will identify avalanche “problems” for 8 aspects (N, NE, E, SE, S, SW, W, NW) and 3 elevations (alpine, treeline, below treeline) per forecast zone — the same format used by regional avalanche centers. The goal is to provide multiple updates per day by analyzing slope angles and previous weather patterns.
Critical point: PEAKS Avy is designed to supplement human forecasters, not replace them. The model will flag problem types and elevations, but the contextual judgment about how a specific snowpack has evolved over the season — the “old buried weak layer” problem that kills experienced backcountry travelers — requires human interpretation. When PEAKS Avy launches, treat it as a rapid-scan tool for first-pass hazard awareness, then cross-reference with your regional avalanche center’s full bulletin.
Step 10: Build Your Pre-Season Data Logging Habit Now
Before PEAKS Avy launches, start documenting your terrain’s snowpack behavior systematically. Record pit data, natural avalanche activity dates, and loading events. When PEAKS Avy goes live, you will have a local dataset to cross-reference against the model’s output — and you will be positioned to identify where the model’s terrain assumptions align or diverge from what you observe in the field.
Expected Outcomes: A practitioner who follows this workflow will have a reliable, elevation-accurate precipitation forecast, credible wind speed data for ridgeline and summit terrain, a severe weather awareness layer with two-minute update resolution, and a framework ready for integrating avalanche hazard AI when PEAKS Avy ships in winter 2026–2027.
Real-World Use Cases
1. Ski Resort Operations: Storm Preparation and Grooming Scheduling
Scenario: A mid-sized ski resort in the Wasatch Range wants to optimize grooming fleet deployment and storm crew staffing 48–72 hours in advance.
Implementation: The operations director queries PEAKS for the summit and mid-mountain elevation zones 3–4 days out. The +42% improvement in precipitation accuracy means the total snowfall forecast for a given storm event is materially more reliable than what the resort’s previous GFS-based workflow provided. The +82% temperature improvement makes snow-rain boundary prediction actionable — the grooming supervisor can determine with more confidence whether a forecasted storm will deposit high-quality dry snow or wet, heavy snow that requires different equipment settings. The director sets StormNet alerts for lightning and damaging wind thresholds that would trigger chairlift evacuation protocols.
Expected Outcome: More accurate storm-prep staffing reduces overtime costs. Better snow-rain boundary forecasts improve grooming decisions on storm nights, reducing equipment wear and producing better morning surface conditions.
2. Backcountry Guiding: Daily Pre-Trip Briefing
Scenario: A licensed guide service in Colorado’s San Juan Mountains builds a daily forecast briefing for clients and field guides.
Implementation: Each morning at 5:00 AM, the lead forecaster pulls PEAKS for the 3 km grid cells covering the day’s planned terrain. The wind speed data at summit elevations identifies which ridgelines and aspects are likely to be wind-loaded from the prior night’s event. The Powder Quality rating and Conditions Summary are included in the client briefing as a plain-language summary. The guide cross-references with the Colorado Avalanche Information Center bulletin (the human forecaster layer that PEAKS Avy will eventually augment).
Expected Outcome: Guides arrive in the field with a more spatially precise picture of where storm totals concentrated and where wind-affected terrain is highest risk, reducing reliance on general regional forecasts that miss micro-terrain variation.
3. Mountain Event Operations: Race and Festival Logistics
Scenario: A trail running event producer managing a 100-mile mountain race wants to predict weather windows for runner safety holds and course modification decisions.
Implementation: The race director subscribes to OpenSnow and sets up StormNet alerts for the race course’s two highest-elevation segments — above treeline ridgelines where lightning risk is the primary safety concern. The 7-day severe weather lead from StormNet provides enough runway to communicate contingency plans to registered runners. PEAKS precipitation data informs course condition forecasts shared with athletes in pre-race briefings.
Expected Outcome: Race staff make informed go/no-go decisions on high-exposure sections with more confidence, backed by data that accounts for their specific terrain rather than a regional forecast that averages over a large area.
4. Avalanche Center Forecasting Support (Post–PEAKS Avy Launch)
Scenario: A regional avalanche center with limited staffing needs to issue multiple hazard updates per day during active storm cycles.
Implementation: When PEAKS Avy launches in winter 2026–2027, forecasters will use its aspect-and-elevation problem identification output as a first-pass analysis layer. The model’s ability to process slope angle and prior weather pattern data multiple times per day reduces the manual analysis load, letting human forecasters focus on field observations, pit data interpretation, and contextual judgment.
Expected Outcome: More frequent hazard updates are possible without proportional increases in forecaster hours — important for centers operating with limited budgets.
5. Subscription App Marketing: OpenSnow’s Business Model as a Template
Scenario: A startup building a niche AI-powered forecasting tool for agriculture (frost prediction, irrigation scheduling) is evaluating monetization strategies.
Implementation: OpenSnow’s 2021 subscription pivot provides a direct analog. As reported in the research briefing, OpenSnow feared losing 90% of users when moving from ad-supported to subscription access. Instead, users who depended on accurate, specialized data retained at industry-leading rates. The lesson: when your AI product produces meaningfully better outcomes than free alternatives in a domain with real operational stakes, users will pay. Build the accuracy case first (document MSE improvements, run retrospective forecasts), then price accordingly.
Expected Outcome: Retention rates that reflect genuine product-market fit rather than free-tier lock-in — a more defensible and scalable revenue base.
Common Pitfalls
1. Using Base Elevation Forecasts for Summit Decision-Making
The 3 km resolution of PEAKS means the model generates distinct forecasts for different elevation bands at the same resort or trailhead. If you query a resort at base lodge elevation and use that forecast to plan summit operations, you are throwing away the model’s most valuable capability. Always anchor your forecast query to the elevation zone where your activity actually occurs.
2. Treating Powder Quality as an Absolute
The Powder Quality rating is a computed interpretation of forecast data — it is not a direct measurement. An algorithm that converts temperature, wind, and precipitation timing into a qualitative score will occasionally misfire, particularly on edge-case temperature scenarios (just-below-freezing storms with variable wind) where the inputs are themselves uncertain. Cross-check the raw temperature and precipitation type forecast before making operational decisions based solely on the rating.
3. Ignoring the Human Forecaster Context
As OpenSnow founder Joel Gratz states in the research report: “AI is just another tool in the toolbox, but it’s a super useful tool for the right situations, and it’s time to learn more about it so that we’re all prepared for the future.” PEAKS processes data in seconds at a scale no human team could match — but OpenSnow still employs 11 full-time staff and contract forecasters to provide narrative context, catch model anomalies, and maintain the “personal connection” to the data. Do not use PEAKS as a black box. Read the human-written commentary alongside the model output.
4. Skipping the Local Bias Correction Step
Even at 3 km resolution, PEAKS cannot know the hyper-local terrain factors that shape your specific zone — a cliff band that creates a wind shadow, a dense forest that reduces surface wind loading, a canyon that funnels orographic lift. The step of logging forecast vs. actual over one to two seasons is not optional if you intend to make high-stakes decisions from model output. Build your local correction factor.
5. Treating StormNet Severe Weather Output as a Substitute for NWS Products
StormNet’s two-minute update cycle and 125 million data point ingestion make it an outstanding real-time situational awareness tool. It is not a regulatory product. National Weather Service watches, warnings, and advisories carry legal and liability weight in many operational contexts (FAA flight rules, race permitting, resort operating agreements). Use StormNet alongside NWS products, not as a replacement.
Expert Tips
1. Layer PEAKS Against the Euro and GFS During Active Pattern Setups
When a major storm cycle is approaching, pull both the PEAKS output and the raw GFS/Euro for your target elevation. Where PEAKS diverges significantly from the global models — particularly on precipitation totals — that divergence is the model doing its job: correcting for known terrain-driven underprediction. Understand why PEAKS diverges, and your forecasting intuition will sharpen.
2. Use the 3 km Grid to Build an Aspect-by-Aspect Wind Loading Map
Before the season, take the time to map the prominent wind directions in your operational terrain against PEAKS’ wind speed outputs for each compass aspect. This gives you a repeatable reference: when PEAKS shows northwest winds at X mph, you know empirically which bowls load heavily. That kind of terrain-indexed wind map is one of the highest-leverage tools a backcountry guide or avalanche professional can have.
3. Archive Your Forecast Data Systematically
PEAKS produces forecast output that is not always archived for long-term retrospective analysis at the user level. Screenshot or export relevant forecast data before and after significant storm events. Over a season, you will accumulate a high-quality dataset of PEAKS forecasts vs. observed conditions — data that is genuinely useful for validating the model against your specific terrain and for training your own judgment.
4. Watch the Operation Sierra Storm Conference for Emerging Techniques
According to the research report, the current leading edge of meteorological AI is focused on “bias correction” and “downscaling” — exactly what PEAKS does — rather than raw data generation. The annual Operation Sierra Storm conference (and comparable regional met conferences) is where this methodological evolution gets presented first. Practitioners who track these developments will understand the next generation of tools before they hit commercial release.
5. Position Your Organization for PEAKS Avy Integration Now
PEAKS Avy is releasing in winter 2026–2027. If your operations depend on avalanche hazard information, start now: standardize your terrain classification into the 8-aspect, 3-elevation framework that PEAKS Avy will output. Organizations that already speak that language in their internal documentation will be able to integrate the new model’s output immediately, rather than spending a season translating between formats.
FAQ
Q: Is OpenSnow and PEAKS only useful for skiing?
No. The PEAKS model generates high-resolution mountain weather data that is relevant for any operation in complex terrain — backcountry guiding, alpine climbing, mountain bike events, trail running, ski resort operations, avalanche center forecasting, and wilderness search and rescue. The Powder Quality and Conditions Summary features are ski-centric, but the underlying precipitation, temperature, and wind data are universally applicable to mountain environments. StormNet, specifically, extends the platform’s utility into all-season severe weather domains.
Q: How does PEAKS compare to WRF (Weather Research and Forecasting Model) runs at high resolution?
WRF can be run at 1–4 km resolution with detailed terrain inputs and is used by some mountain-forecast platforms and research institutions. The key differences are operational: running WRF at high resolution is computationally expensive and typically produces forecasts that are updated every 6–12 hours. PEAKS, as an AI downscaling layer applied to real-time global model output, can generate inferences in seconds and be updated as frequently as the underlying model data refreshes. PEAKS also benefits from 42 years of training data specifically targeting mountainous terrain bias correction.
Q: What was the business case for OpenSnow’s subscription model shift in 2021?
According to the research report, OpenSnow moved from ad-supported free access to a paid subscription model in 2021 despite internal fears of losing up to 90% of users. The outcome was the opposite: traffic and retention reached industry-leading rates. The explanation is straightforward — users who depend on accurate mountain forecasts for operational or safety decisions have a high willingness to pay for measurably better data. The ad-based model commoditized the product; the subscription model aligned the company’s revenue with user outcomes.
Q: When will PEAKS Avy be available, and what exactly will it forecast?
PEAKS Avy is scheduled for release in winter 2026–2027, according to the research report. It will identify avalanche “problems” — the categorical hazard types used by North American avalanche centers (wind slab, storm slab, persistent weak layer, wet avalanche, etc.) — for 8 terrain aspects and 3 elevation bands per forecast zone. Its stated goal is to run multiple times per day, providing more frequent hazard awareness updates than current human-staffed forecasting cycles allow. It is designed to supplement, not replace, certified avalanche forecasters.
Q: Does the PEAKS model work outside North America?
The research report documents PEAKS performance data primarily from North American test sites, with Alta, Utah cited specifically as a validation case study. OpenSnow’s historical user base and content has been concentrated in North American ski destinations. However, the underlying U-Net architecture trained on 1979–2021 global reanalysis data has no inherent geographic limitation — the question is whether the training data adequately represents the terrain characteristics of European, South American, or Asian mountain ranges. OpenSnow has not publicly announced international expansion of PEAKS coverage as of March 2026.
Bottom Line
OpenSnow’s PEAKS model is the most technically credible demonstration to date that a small, domain-focused team can build AI forecasting tools that materially outperform general-purpose government models in complex terrain. The accuracy numbers — +42% on precipitation, +82% on temperature, +72% on wind speed — are not marginal improvements. Combined with StormNet’s real-time severe weather layer and the upcoming PEAKS Avy avalanche product, OpenSnow is building a vertically integrated mountain safety intelligence platform, not just a snow forecast app. As Joel Gratz put it in the research report: “AI is just another tool in the toolbox, but it’s a super useful tool for the right situations.” The practitioners who learn to use these tools — and layer their own terrain knowledge on top — will make better decisions in the mountains than those who rely on blunt global model output. The future of niche AI forecasting belongs to the specialists.


0 Comments