

Running a campaign at 7x ROAS and pushing it to 10x by narrowing audiences sounds like smart optimization. It isn’t. According to Jaimon Hancock, Founder of Adalystic Marketing, the moment you eliminate campaigns running at 5-6x ROAS to chase a cleaner dashboard number, “future scaling has been reduced, if not eliminated entirely.” This tutorial walks through the exact frameworks — Marginal ROAS, Incrementality Testing, Value-Based Bidding, and Unified Measurement — that elite advertisers are using in 2026 to break out of the efficiency trap and build campaigns that grow without cannibalizing themselves.
What This Is: The Efficiency Trap and Why ROAS Lies to You
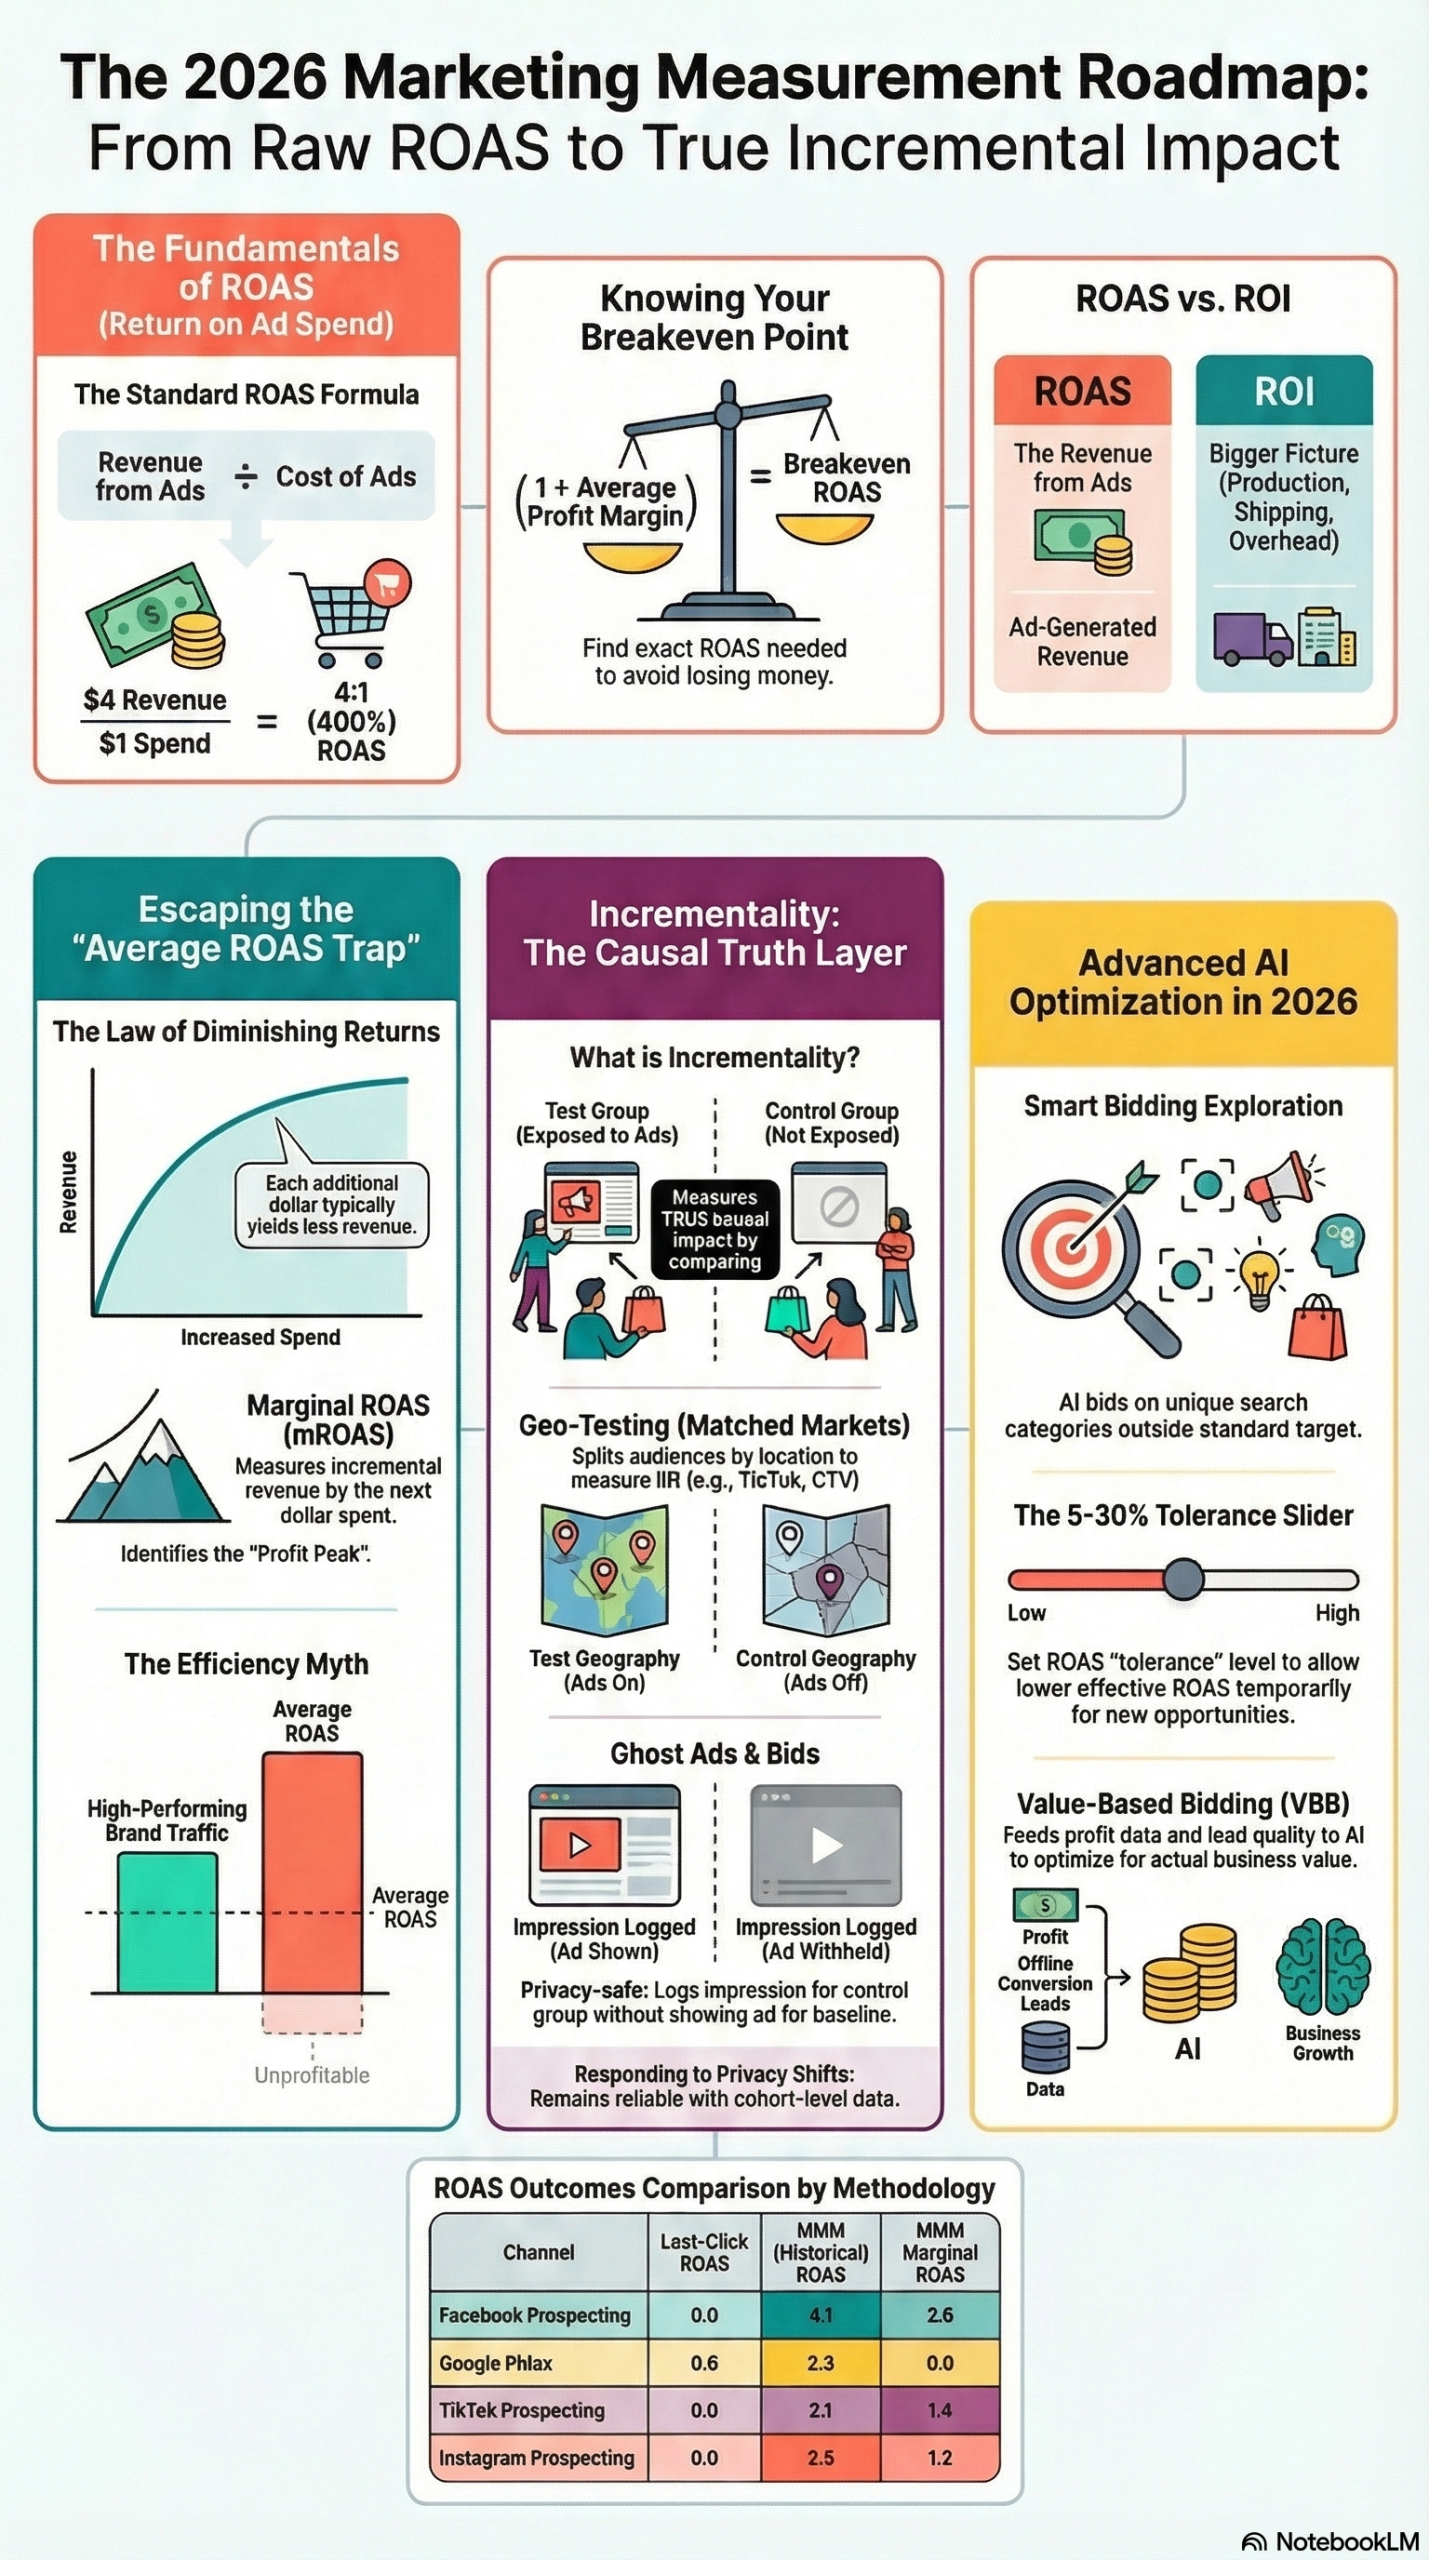
The efficiency trap is a failure mode that looks like success. A marketing team optimizes aggressively toward a single efficiency metric — usually Return on Ad Spend (ROAS) — and the number climbs. Dashboards look healthy. Leadership is happy. But underneath, the campaign has been systematically cutting off the top-of-funnel volume that creates future demand. As Hancock explains, “the metrics you choose to optimize aren’t just measurements. They’re instructions.” Optimizing for ROAS as a single signal instructs the algorithm — and the team — to push toward bottom-of-funnel, high-intent, lowest-risk traffic. That audience is finite.
The deeper technical problem is the difference between Average ROAS and Marginal ROAS (mROAS). Average ROAS is the aggregate efficiency of your entire spend: total revenue divided by total cost. Marginal ROAS is what the next dollar spent actually returns. These numbers diverge sharply once a channel approaches saturation.
According to the 2026 Strategic Briefing on Marketing Impact and Incrementality, ad performance follows a curve of diminishing returns. As spend increases, each additional dollar yields less revenue due to audience saturation and increased competition for the same impressions. A campaign posting an impressive 8x Average ROAS might be generating only 1.5x or even 0.8x on marginal spend — meaning every additional dollar is actively losing money while the aggregate metric masks the problem entirely.
The formula difference matters:
- Average ROAS: (Total Revenue from Ads) ÷ (Total Ad Cost)
- Marginal ROAS (mROAS): (Change in Revenue) ÷ (Change in Ad Spend)
The second number tells you whether to scale. The first number tells you what already happened.
This same trap manifests in siloed channel optimization. When teams optimize paid search, paid social, and email independently — each chasing their own efficiency target — they miss leverage points across the customer journey. Hancock’s article illustrates this with a three-product scenario: a brand paying for expensive paid media on low-intent products (B and C) wastes budget when those products are better served by CRM and retargeting flows — acquired first through the core product (A). Fixing this requires holistic measurement, not per-channel dashboards.
The research report frames the corrective approach as Unified Measurement: triangulating Multi-Touch Attribution (MTA) for real-time optimization signals, Marketing Mix Modeling (MMM) for macro budget allocation decisions, and Incrementality Testing as the causal validation layer — the only method that actually proves whether your ads caused a sale.
Why It Matters: Who Gets Hurt and What Changes
This is not an academic problem. Any advertiser running Google Ads, Meta, or TikTok at meaningful scale will hit the efficiency trap if they optimize toward a single ROAS target without monitoring marginal returns.
Agencies are particularly exposed. Client reporting built around Average ROAS numbers looks great until a client tries to scale and discovers that doubling the budget produces a 20% revenue increase, not a 100% increase. The research report notes that traditional attribution models — including multi-touch attribution and last-click — systematically over-credit ad platforms, making this problem worse. The platform’s own reporting confirms the purchase happened after an ad exposure; it does not confirm the purchase required that ad exposure.
Performance marketers running Google’s Smart Bidding at scale face a different version of the problem. In 2026, Smart Bidding evaluates over 3,800 auction-time signals — device, location, weather, intent signals — in 100 milliseconds. The system is making approximately 50,000 dynamic micro-decisions daily. At that speed and complexity, a human feeding it a simple Revenue/Cost target is giving it incomplete instructions. Without profit data, the algorithm optimizes for revenue that may be unprofitable at the margin.
E-commerce brands with mixed-margin product catalogs face the sharpest version of this: a $200 widget with 60% margin and a $200 widget with 15% margin both look identical to an algorithm optimizing for revenue ROAS. Value-Based Bidding, which feeds profit data rather than revenue into the algorithm, is the structural fix — and it requires first-party data infrastructure most brands don’t have out of the box.
The practitioners who get this right gain a compounding advantage: their algorithm learns to identify high-value prospects that competitors’ algorithms ignore. As the research report notes, integrating CRM data via Enhanced Conversions for Leads lets the system optimize for closed revenue, not just form fills — a meaningful edge in B2B and high-consideration B2C categories.
The Data: ROAS Metrics Compared
| Metric | Formula | What It Tells You | When to Use It |
|---|---|---|---|
| Average ROAS | Revenue ÷ Ad Cost | Aggregate efficiency of total spend | Reporting to stakeholders, trend monitoring |
| Breakeven ROAS | 1 ÷ Profit Margin | Minimum ROAS to avoid losing money | Setting campaign floors and bid targets |
| Marginal ROAS (mROAS) | ΔRevenue ÷ ΔAd Spend | Efficiency of the next dollar spent | Budget scaling decisions, saturation detection |
| Incremental ROAS (iROAS) | Incremental Value ÷ Incremental Cost | Causal, net-new revenue from advertising | Channel validation, budget reallocation |
| Customer Lifetime Value (CLV) | Total expected revenue per customer relationship | True long-term value of an acquisition | Justifying higher CPAs for quality segments |
Source: MarketingAgent Research Report — Marketing Impact and Incrementality 2026
The critical column is iROAS — the only metric in this table that is derived from a controlled experiment rather than platform-reported attribution. It’s also the one most advertisers are not yet calculating. That gap is where budget gets wasted.
Step-by-Step Tutorial: Building a Unified Measurement System
The research report outlines a three-phase implementation roadmap that I’ve condensed and made tactically executable. This is the actual sequence to move from Average ROAS dependency to a measurement framework that survives scale.
Prerequisites
Before you start, you need:
– Google Ads account with conversion tracking active
– Access to Google Analytics 4 (GA4) or equivalent analytics
– A CRM or customer data platform with at least 3 months of customer history
– At minimum 50 conversions per month in your primary campaign (required for Smart Bidding)
– Budget flexibility of at least 15% (required for exploration and testing)
Phase 1: Foundation — Fix the Data Layer (Month 1)
Step 1: Audit Your Conversion Tracking
Before you measure anything, confirm you’re measuring the right things. Pull your Google Ads conversion actions and audit each one:
– Is the conversion action firing on actual purchases or on thank-you page loads regardless of payment completion?
– Are you double-counting conversions from both GA4 and the Google Ads tag?
– Is your conversion window appropriate for your sales cycle? (A B2B company with a 60-day sales cycle should not use a 7-day conversion window.)
Delete or disable any conversion action you wouldn’t hand $50K to optimize toward.
Step 2: Implement Enhanced Conversions
Enhanced Conversions passes hashed, first-party customer data (email, phone, address) back to Google at the point of conversion. This improves attribution accuracy in a cookieless environment and — critically — enables Enhanced Conversions for Leads, which allows Google to eventually match form fills to closed revenue in your CRM.
In Google Ads, navigate to Tools → Conversions → Settings → Enhanced Conversions and enable it for web. You’ll need to pass the email field from your checkout or lead form through the Google tag or GTM.
Step 3: Switch to Data-Driven Attribution (DDA)
Last-click attribution gives 100% of the credit to the final touchpoint before conversion. It is wrong by construction for any customer with more than one touchpoint. Switch every conversion action to Data-Driven Attribution:
Go to Tools → Conversions → [Conversion Action] → Attribution Model → Data-Driven.
DDA uses machine learning to distribute credit across the actual touchpoints that contributed to each conversion, based on observed conversion path patterns in your account. It requires a minimum number of conversions to activate (varies by account, typically 300+ conversions in 30 days for primary actions), but it is materially more accurate than position-based or linear models.
Step 4: Calculate Your Breakeven ROAS
This is the most important number in your account and most teams don’t know it. The formula from the research report:
Breakeven ROAS = 1 ÷ Average Profit Margin
If your average order margin is 35%, your Breakeven ROAS is 2.86x. Any campaign running below 2.86x ROAS is losing money regardless of how the revenue number looks. Build this into your bidding strategy targets — your tROAS should always be set above breakeven.
Step 5: Run a Negative Keyword Audit
The research report explicitly flags this as Phase 1 work. Pull your Search Terms report for the last 90 days and identify:
– Informational queries with no purchase intent (“how to use X”)
– Job-seeking queries (“X company careers”)
– Competitor brand terms you’re spending on but not winning
– Product variants or sizes you don’t carry
Add these as negative keywords at the campaign or account level. This alone typically improves conversion rate 10-25% in accounts that haven’t been systematically managed.
Phase 2: AI Transition — Smart Bidding and Value-Based Rules (Months 2-3)
Step 6: Move Qualifying Campaigns to Smart Bidding
Smart Bidding is only effective above the research report’s threshold: 50+ conversions per month for tROAS, or 30+ for Target CPA. Below that, the algorithm lacks the signal volume to learn effectively and you’ll see erratic spend behavior.
For campaigns meeting the threshold:
1. Start with Target CPA if your orders have relatively uniform value
2. Use Target ROAS if you have meaningful variation in order value (and pass revenue values into your conversion tag)
3. Set your initial target at your current 30-day average CPA or ROAS, not an aspirational number
Give the system at least 7-14 days before evaluating performance. The research report recommends allowing 2-3 full conversion cycles before making adjustments — cutting the experiment early is the most common mistake.
Step 7: Implement Value-Based Bidding Rules
Standard ROAS treats all revenue as equal. VBB corrects this by feeding profit-adjusted values to the algorithm. In Google Ads, navigate to Tools → Conversions → Conversion Value Rules and create rules for:
- New vs. Returning Customers: The research report documents the specific approach of weighting new customers 3x higher than returning ones. If a returning customer is worth $100 in expected lifetime value, a new customer at the same order value might be worth $300 when LTV is factored in.
- Geographic Margin Differences: If your product margin is 40% in the U.S. and 28% internationally due to shipping and duty costs, adjust conversion values by geography so the algorithm doesn’t over-allocate to lower-margin markets.
- Product Category Margins: If your checkout handles both 60%-margin software licenses and 12%-margin hardware accessories, pass product-level margin data through your conversion tag.
Step 8: Upload Customer Match Lists
Upload your CRM customer list (hashed emails and phone numbers) as a Customer Match audience in Google Ads. This serves two purposes:
1. Allows the algorithm to identify similar high-value prospects in auction data
2. Creates the foundation for excluding existing customers from new-customer acquisition campaigns
The research report describes this as building a “competitive moat” — your algorithm now has training data your competitors don’t.
Phase 3: Scaling and Experimentation (Months 4-6)
Step 9: Run an Incrementality Test
Incrementality testing is the only way to know whether your ads are actually causing sales or just showing up near organic purchases. The research report outlines three methodologies:
- Geo Testing: Split markets by geography, run ads in treatment regions, hold back in control regions. Measure lift in business outcomes (revenue, new customer acquisitions) across groups. Best for upper-funnel channels (YouTube, TikTok, CTV, podcasts) where click signals are weak.
- Ghost Ads / PSA Testing: In user-level experiments, withhold ads from a randomized holdout group (or show neutral PSA content). Compare conversion rates between groups.
- Synthetic Control Groups: Use historical and cross-sectional data to model expected baseline performance without ads. Useful when clean geographic splits are impractical.
Run your test for at least 4-6 weeks to capture a full conversion cycle and filter out weekly seasonality. The output is your iROAS — the causal, net-new revenue your ads generated per dollar spent. Compare this to your Average ROAS to quantify how much of your reported performance is incremental versus organic.
Step 10: Enable Smart Bidding Exploration
For high-volume search campaigns on tROAS, the research report documents Google’s Smart Bidding Exploration feature: set a ROAS tolerance of 5-30% to allow the algorithm to bid on new, potentially high-value search categories it would normally underbid on to protect the current ROAS target.
This is explicitly an exploration budget. Expect short-term ROAS variation. The payoff is identifying segments that have high conversion potential but haven’t been in the algorithm’s playbook. One critical requirement from the research report: ensure campaigns are not budget-constrained. Smart Bidding Exploration is ineffective if the campaign is throttling spend — the algorithm needs room to test new territory.
Expected Outcomes
After completing the three phases over 4-6 months, practitioners should see:
– Cleaner conversion data with fewer phantom conversions inflating reported numbers
– Algorithm performance that more accurately reflects business profit, not just revenue
– Validated incrementality data to defend or challenge channel budget allocations
– Identification of new audience segments through exploration mode
– A first-party data infrastructure that compounds in value over time
Real-World Use Cases
Use Case 1: E-Commerce Brand Breaking Past a ROAS Ceiling
Scenario: A DTC skincare brand has been running Google Shopping at 6x ROAS for 8 months. Every attempt to scale budget results in ROAS dropping to 4x and the team pulling back. Growth has stalled.
Implementation: The team calculates their Breakeven ROAS at 2.5x (40% margin). They recognize that 4x is still profitable — they’ve been optimizing for an efficiency target that had no relationship to profitability. They implement Value-Based Bidding with Customer Match lists, upload 12 months of customer purchase history, and enable Smart Bidding Exploration with a 15% tolerance. They define the efficiency floor as 3x ROAS and optimize for volume above that threshold, following Hancock’s recommendation to set minimum acceptable returns and maximize volume above them.
Expected Outcome: Revenue scales 35-50% at reduced Average ROAS (dropping from 6x to 4.5x) but materially higher profit, because the additional spend is going to new-customer segments with high LTV rather than recycling budget on returning purchasers.
Use Case 2: B2B SaaS Company Validating Lead Quality
Scenario: A B2B software company generates 400 form fills per month from Google Ads at a 3x ROAS. The sales team says 70% of leads are unqualified. The algorithm is optimizing for form fills, not revenue.
Implementation: The company implements Enhanced Conversions for Leads, connecting their CRM (HubSpot or Salesforce) to import closed-won deal data back into Google Ads. They create a new conversion action weighted at the actual deal value and reduce the weight of raw form fills. Per the research report, this allows the algorithm to optimize for closed revenue rather than pipeline volume.
Expected Outcome: Form fill volume drops 30%, but SQL rate improves from 30% to 60% as the algorithm identifies the search intent patterns associated with qualified buyers. Revenue per advertising dollar increases materially.
Use Case 3: Agency Proving Channel Value with Incrementality
Scenario: An agency managing a retail client’s YouTube budget is asked to defend the channel. YouTube ROAS looks poor compared to branded search. Leadership is considering cutting it.
Implementation: The agency runs a 6-week geo-based Conversion Lift study, splitting comparable DMAs into test (YouTube exposure) and control (no YouTube) groups. They measure new customer acquisition and total revenue across both groups, controlling for seasonality.
Expected Outcome: The test reveals that YouTube drives a 22% lift in new customer acquisition in exposed markets — incremental volume that does not appear in YouTube’s own attribution reports because the conversions happen days later on branded search. Budget is defended with causal data rather than platform-reported ROAS. Per the research report, this is exactly the use case for geo testing: upper-funnel channels where click signals are weak.
Use Case 4: Performance Max Campaign Rescue
Scenario: A retailer launched PMax six months ago. It’s generating volume but the team suspects it’s eating branded search and retargeting traffic rather than finding new customers.
Implementation: Following the research report’s PMax constraint framework: enable “Bid primarily for new customers” in campaign settings, upload Customer Match exclusion lists of existing customers, build out asset groups with at least 15-20 images, 4-8 videos (including UGC), and 15 headlines structured across brand, feature, benefit, social proof, and CTA categories. Add brand terms as negative keywords at the account level to prevent PMax from cannibalizing branded search campaigns.
Expected Outcome: PMax spend shifts toward genuine new-customer acquisition. Branded search campaigns maintain their volume. Net new customer count increases while blended ROAS may decrease slightly — which is acceptable when new customers carry higher LTV than the marginal returning customer.
Common Pitfalls
Pitfall 1: Optimizing ROAS Without a Breakeven Floor
Teams set tROAS targets based on historical averages or gut feel, not profit margins. The result is chasing efficiency targets that may be above or below the actual profitable threshold. Fix it: calculate Breakeven ROAS (1 ÷ margin) first, then set targets above it with explicit rationale, per the research report’s formulas.
Pitfall 2: Cutting Smart Bidding Too Early
The most common smart bidding mistake is evaluating performance after 3-4 days and reverting when numbers look inconsistent. The research report specifies allowing 2-3 conversion cycles before assessment — for a business with a 14-day consideration cycle, that’s 28-42 days minimum. Cutting experiments early locks in the problem you were trying to solve.
Pitfall 3: Running PMax Without Asset Diversity
The research report documents the precise risk: “If you provide limited assets, [AI] has nothing to optimize. Think of it like this: You’re asking AI to paint a masterpiece but only giving it three colors.” PMax running with 2-3 images and no video defaults to low-quality dynamic display placements. The minimum viable asset library is 15+ images, 4+ videos, and 15 headlines.
Pitfall 4: Treating All Conversions as Equal in VBB
Passing raw revenue values to Google Ads without adjusting for margin means the algorithm bids the same for a 10% margin sale and a 60% margin sale at the same revenue figure. Use Conversion Value Rules to adjust for product category margins, customer type, and geography before letting the algorithm loose.
Pitfall 5: Skipping Incrementality Validation
Running MTA or platform-attributed ROAS without incrementality testing means you’re measuring correlation, not causation. Hancock’s core argument and the research report both emphasize that platforms systematically over-credit themselves. Without a holdout group, you cannot know how much of your reported revenue would have happened without the ad.
Expert Tips
1. Set Efficiency Floors, Then Optimize for Volume
Rather than setting a single ROAS target and optimizing toward it, define the minimum acceptable ROAS (your breakeven plus a safety margin) and then push for maximum volume above that floor. Hancock explicitly recommends this inversion — it preserves growth potential while maintaining profitability guardrails.
2. Use the 15-Headline RSA Framework Systematically
The research report documents a specific Responsive Search Ad structure for feeding AI systems: 3 headlines for Brand/Core Value, 3 for Features, 3 for Benefits, 3 for Social Proof, 3 for CTAs. This isn’t aesthetic advice — it ensures the algorithm has meaningful variation across intent categories to test, rather than 15 minor variations of the same message.
3. Run Incrementality Before Budget Reallocation Decisions
Before cutting a channel that looks inefficient on attributed ROAS, run a holdout test. The research report documents a recurring pattern: upper-funnel channels (YouTube, CTV, podcasts) consistently look poor on click-based attribution but show strong incrementality in geo tests. Cutting them destroys demand that feeds lower-funnel campaigns.
4. Feed LTV, Not Revenue, Into the Algorithm
For any category with meaningful repeat purchase behavior, calculate predicted 12-month Customer Lifetime Value by acquisition source and pass that value — rather than first-order revenue — into your conversion value. The research report notes this allows the algorithm to bid more aggressively for high-LTV prospect segments, justifying higher initial CPAs that look expensive on session-level ROAS but are profitable at the relationship level.
5. Ensure Exploration Campaigns Are Budget-Unconstrained
Smart Bidding Exploration only works if the campaign has room to spend into new territory. A budget-limited campaign running at near-100% budget utilization cannot explore. The research report flags this explicitly: exploration mode requires unconstrained budgets. If you’re exploring, give the campaign a 30-40% budget buffer above its current average daily spend.
FAQ
Q1: What’s the minimum data volume needed before switching to Smart Bidding?
The research report sets the threshold at 50+ conversions per month for Target ROAS and approximately 30+ for Target CPA. Below these thresholds, the algorithm lacks sufficient signal to make accurate predictions, and you’ll see erratic spend behavior during the learning phase. Campaigns below these volumes should use manual CPC with bid adjustments or enhanced CPC until volume builds.
Q2: How long does an incrementality test need to run?
At minimum, 4-6 weeks according to the research report. The test must capture at least one full conversion cycle — the time from first ad exposure to purchase decision — for your category. It also needs to run long enough to average out day-of-week variation. Running for less than 4 weeks risks false positives or false negatives due to weekly seasonality or short-term outliers.
Q3: Will Value-Based Bidding hurt my ROAS metrics?
Yes, in the short term, Average ROAS will likely decrease when you switch from revenue-based to profit-based optimization — because the algorithm will correctly deprioritize high-revenue but low-margin conversions. This is the intended outcome. Your profit per dollar spent will increase even as the ROAS number drops. Communicate this expectation to stakeholders before implementing VBB, or the results will look like degradation.
Q4: Can I run incrementality testing without a formal experiment tool?
Basic geo-based testing can be run manually by splitting geographic markets and comparing business outcomes (website revenue, in-store sales, new customer registrations) between test and control regions over 4-6 weeks. More rigorous approaches use Google’s Conversion Lift studies, Meta’s Conversion Lift feature, or third-party tools like Measured or Northbeam. The research report also references synthetic control methodologies for markets where clean geographic splits aren’t available.
Q5: How does Performance Max fit into a measurement framework that already includes brand search and retargeting?
PMax should be constrained so it does not compete with existing campaigns for branded or retargeting traffic. The research report recommends enabling “Bid primarily for new customers,” adding negative keyword exclusions at the account level for brand terms, and using Customer Match exclusion lists to remove existing customers from PMax targeting. Treat PMax as your new-customer acquisition engine — not a replacement for the full campaign stack.
Bottom Line
The ROAS efficiency trap is a measurement failure disguised as a performance success. Campaigns that look exceptional on Average ROAS can be operating at negative Marginal ROAS — meaning every additional dollar spent is destroying value while the aggregate metric stays green. The fix is not complex, but it is sequential: fix the data layer first, implement Value-Based Bidding second, validate with incrementality testing third. As Hancock frames it plainly, “better isn’t always best — sometimes the smartest optimization is knowing when to stop” chasing a single efficiency number and start building systems that measure causal impact. Practitioners who make this transition in 2026 will hold a structural advantage as AI-driven bidding systems mature: their algorithms will have better data, identify higher-value segments, and compound that advantage over time. The floor is profitability; the goal is growth.


0 Comments