

Most SEO conversations stall at rank targets — “we need to be on page one” — without ever attaching a dollar figure to that ambition. A revenue-first calculator changes that dynamic entirely, forcing teams to tie organic search position directly to pipeline, and giving executives the business case they actually need to fund SEO investment. This tutorial walks you through exactly how that calculator works, how to build your own version, and how to operationalize the output as a repeatable planning tool.
What This Is
The calculator described by Martech.zone (published April 2, 2026) takes four practitioner inputs — your keyword’s monthly search volume, your current SERP position, your average transaction value, and your estimated conversion rate — and outputs the additional monthly and annual revenue that sits between your current rank and rank #1.
That framing is deceptively powerful. Instead of reporting that you moved from position 8 to position 3, you tell your CFO: “We captured an additional $47,000 in monthly pipeline by closing that ranking gap.” Those are different conversations, and the second one is the one that unlocks budget.
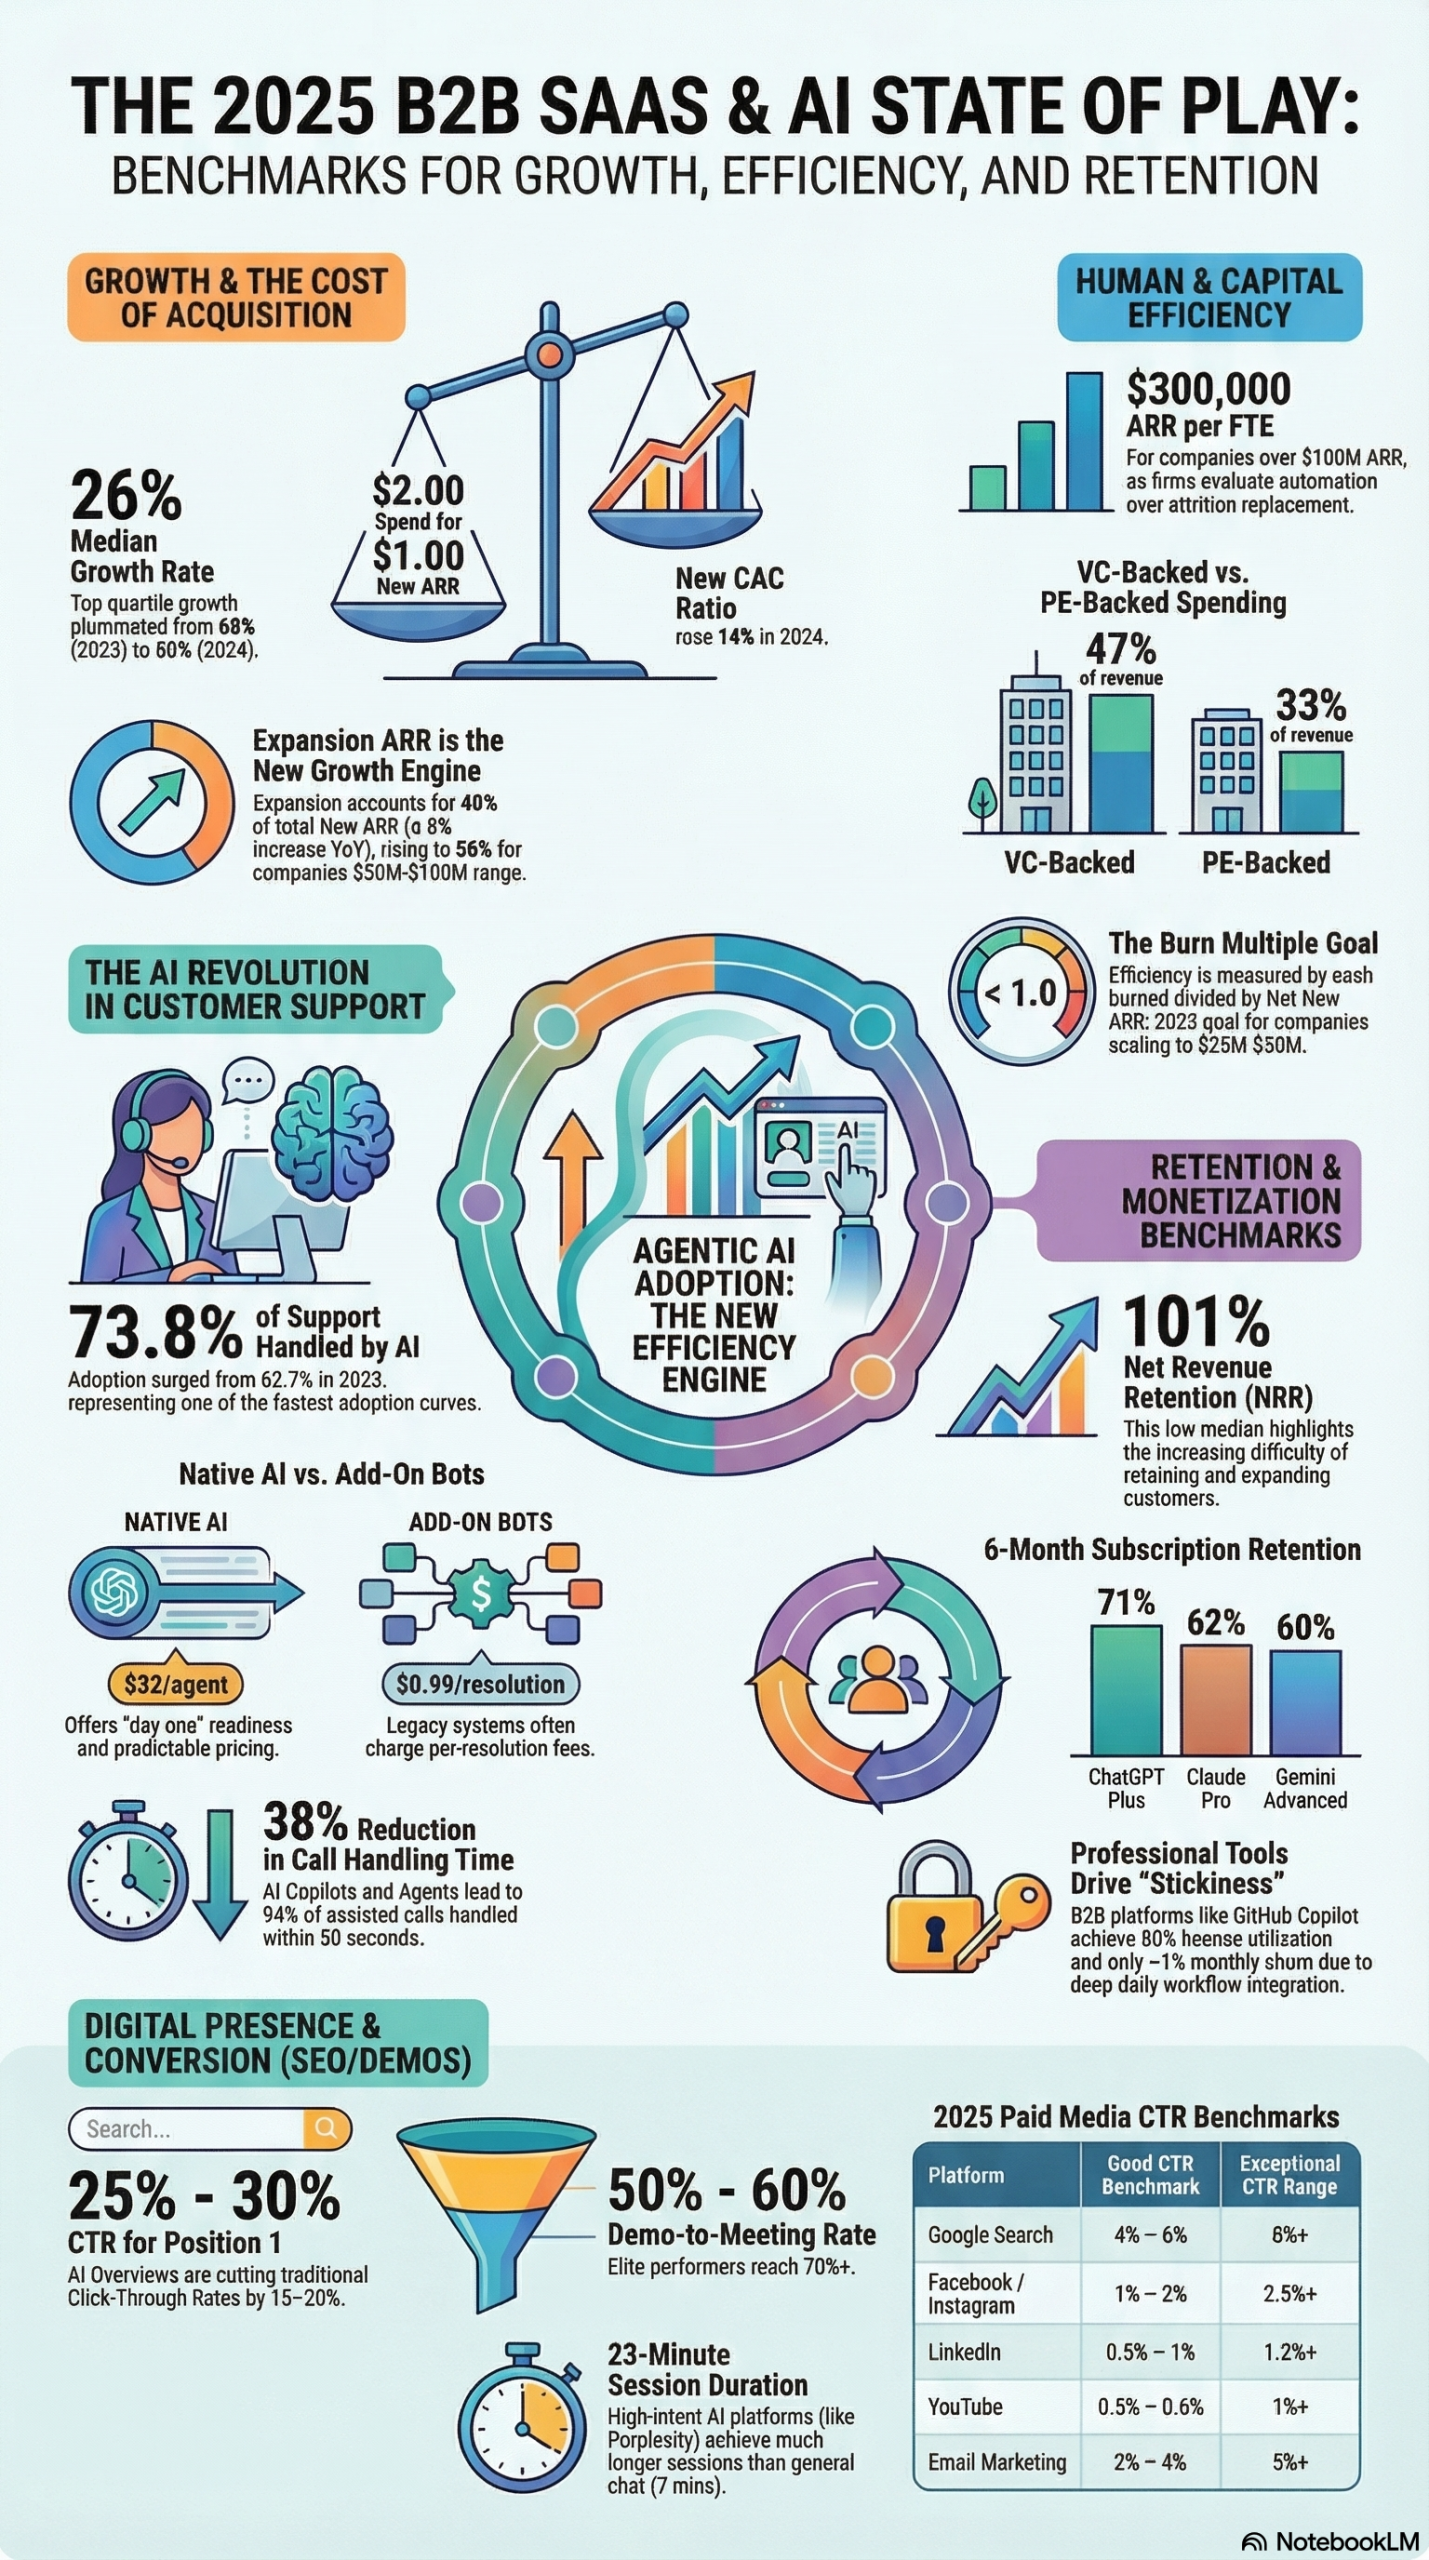
The math underneath the calculator is straightforward, but it depends on one critical variable most SEO tools treat as an afterthought: the click-through rate (CTR) curve by SERP position. CTR is not linear. Position 1 doesn’t capture twice as many clicks as position 2 — it captures roughly three to five times as many. According to the 2025 B2B SaaS and AI Performance Briefing (our primary research source), the average CTR for position 1 sits at 25–30%. That’s your ceiling. Every position below that is a ceiling you haven’t reached yet, and every percentage point of CTR delta translates directly into revenue delta when you multiply it against search volume and transaction value.
Here is the core revenue formula the calculator applies:
Estimated Monthly Revenue =
  Monthly Search Volume × Position CTR% × Site Conversion Rate × Avg. Transaction Value
To find the revenue gap between your current position and rank #1:
Revenue Gap =
  (Position 1 CTR − Current Position CTR) × Monthly Search Volume
  × Site Conversion Rate × Avg. Transaction Value
This is not a vanity metric. It is a direct expression of organic search underperformance in dollars, and it gives SEO a seat at the revenue table for the first time in most organizations.
The AI Overview Wrinkle
One critical nuance the calculator must account for in 2026: AI Overviews (formerly Search Generative Experience) are compressing position 1 CTR. According to the 2025 B2B SaaS and AI Performance Briefing, AI Overviews are reducing traditional click-through rates by 15–20% for queries where they appear. That means for AI-heavy SERPs, a position 1 result that might historically have earned 28% CTR is now earning closer to 20% CTR. The calculator should use the adjusted figure for any keyword where AI Overviews appear regularly — which, as of 2026, covers a significant share of informational and commercial-intent queries.
Understanding this distinction is the difference between a revenue projection that’s directionally correct and one that sets unrealistic pipeline expectations.
Why It Matters
SEO investment decisions have always suffered from a measurement problem. Ranking is an output metric — it tells you where you are, not what that position is worth. This calculator converts SERP position into a revenue proxy, which does four specific things for practitioners:
1. It creates a defensible budget request. When SEO is framed as “we rank #8 and want to rank #1,” the business has no way to prioritize that against other growth investments. When SEO is framed as “ranking #1 for this term would generate an additional $380,000 in annual revenue,” the ROI math writes itself.
2. It prioritizes keyword targets by financial impact, not search volume alone. A keyword with 50,000 monthly searches and a $12 transaction value may be less valuable than a keyword with 5,000 monthly searches and a $1,200 transaction value. High-value enterprise SaaS terms with lower search volume but high ACV often represent the better investment. According to the 2025 B2B SaaS and AI Performance Briefing, the median Annual Contract Value for private B2B SaaS companies reached $26,265 in 2024 — a number that makes even modest ranking improvements on low-volume keywords financially significant.
3. It benchmarks SEO against other acquisition channels. When you know that ranking #1 for a target keyword would deliver $40,000/month in projected revenue, you can compare that against what paid search costs for the same traffic, or what an outbound SDR team costs to generate equivalent pipeline. According to the 2025 B2B SaaS and AI Performance Briefing, the median B2B SaaS company spent $2.00 to acquire $1.00 of new ARR through new customer acquisition in 2024. Organic search, when ranked, costs a fraction of that on an incremental basis.
4. It holds SEO accountable to business outcomes. Ranking improvements become measurable not just in position delta but in revenue delta. This closes the accountability loop that has made SEO a hard discipline to fund in budget cycles.
The calculator is particularly valuable for marketing agencies presenting client business cases, in-house SEO teams seeking headcount or tool investment, and growth leaders building channel mix models. If you run any account that includes organic search, this calculator should be in your standard toolkit.
The Data: CTR Benchmarks by SERP Position
The revenue calculation hinges on accurate CTR assumptions. Below are SERP position CTR benchmarks, including the adjusted figures accounting for AI Overview impact in 2026. CTR data for position 1 is sourced directly from the 2025 B2B SaaS and AI Performance Briefing; estimates for other positions reflect the well-documented exponential decay of the CTR curve.
| SERP Position | Standard CTR (%) | CTR with AI Overview Present (%) | Notes |
|---|---|---|---|
| 1 | 25–30% | ~20% | Research Report: AI Overviews reduce CTR 15–20% |
| 2 | 15–18% | 12–14% | Significant drop from position 1 |
| 3 | 10–13% | 8–10% | Still meaningful share capture |
| 4 | 7–9% | 5–7% | Below-fold on many mobile devices |
| 5 | 5–7% | 4–5% | Diminishing returns zone begins |
| 6–10 | 2–5% | 1–3% | Long-tail CTR territory |
| Page 2+ | <1% | <1% | Effectively zero commercial intent traffic |
Key takeaway: The gap between position 1 and position 2 is larger than the entire gap between positions 2 through 10 combined. This is why the calculator focuses specifically on the revenue value of reaching position 1, not just “moving up” in rankings. According to the 2025 B2B SaaS and AI Performance Briefing, site speed is also a “ranking powerhouse” in 2025–2026, with performance targets of under 2.5 seconds for mobile and approximately 1.5 seconds for desktop — factors that directly influence whether you hold a position 1 ranking once you earn it.
Step-by-Step Tutorial: Building and Using an SEO Revenue Calculator
This tutorial walks you through building a functional SEO revenue calculator in a spreadsheet, populating it with real keyword data, and using the output to prioritize your content and link-building investment.
Prerequisites
- Access to Google Search Console or a third-party rank tracker (Ahrefs, Semrush, Moz)
- Your site’s average conversion rate (from Google Analytics or your CRM)
- Your average transaction value or average contract value
- A Google Sheets or Excel spreadsheet
Phase 1: Gather Your Inputs
Step 1: Pull your current keyword rankings.
Export your top 50–100 keywords from Google Search Console (Performance → Search Results → export). You want: keyword, current average position, impressions, and clicks. Filter for keywords where your average position is between 2 and 20 — these are your gap-opportunity keywords. Keywords where you’re already at position 1 have minimal upside; keywords at position 21+ typically require more foundational work before the revenue calculation is meaningful.
Step 2: Identify your keyword-level search volume.
Search Console gives you impressions, which is a proxy for search volume. For more accurate monthly search volume, cross-reference your top opportunity keywords in Ahrefs or Semrush. Export the monthly search volume column alongside your current rank. For keywords you don’t yet rank for but are targeting, pull search volume directly from your keyword research tool.
Step 3: Establish your conversion rate by traffic type.
This is where most calculators fail — they apply a single site-wide conversion rate to every keyword, which is inaccurate. Your site’s conversion rate varies significantly by keyword intent. A bottom-funnel keyword like “buy [product] online” converts at a different rate than an informational keyword like “how does [product] work.” Break your conversion rate into at least three tiers:
- Bottom-funnel keywords: use your paid search conversion rate as a proxy (these searchers have purchase intent most similar to PPC traffic)
- Mid-funnel keywords: use 30–50% of your site-wide conversion rate
- Top-funnel / informational keywords: use 10–20% of your site-wide conversion rate
Step 4: Confirm your average transaction value.
For e-commerce, this is straightforward: pull average order value from your analytics platform. For SaaS, use your average deal size or ACV. For lead generation, estimate a close rate and multiply by deal size (e.g., 15% close rate × $8,000 ACV = $1,200 average revenue per lead). The 2025 B2B SaaS and AI Performance Briefing notes that global e-commerce average order value sits at approximately $145, while B2B SaaS median ACV reached $26,265 in 2024 — the revenue math is structurally different across business models and your transaction value input needs to reflect your actual model.
Phase 2: Build the Spreadsheet Model
Step 5: Set up your spreadsheet columns.
Create the following columns in your spreadsheet:
| Column | Label | Formula / Input |
|---|---|---|
| A | Keyword | Manual input |
| B | Monthly Search Volume | From rank tracker |
| C | Current SERP Position | From Search Console |
| D | Current CTR% | Lookup from CTR table above |
| E | Position 1 CTR% | 0.25 (or 0.20 if AI Overview present) |
| F | Current Monthly Traffic | =B × D |
| G | Position 1 Monthly Traffic | =B × E |
| H | Traffic Gap | =G − F |
| I | Conversion Rate | Per keyword tier (manual) |
| J | Avg. Transaction Value | Manual input |
| K | Current Monthly Revenue | =F × I × J |
| L | Position 1 Monthly Revenue | =G × I × J |
| M | Monthly Revenue Gap | =L − K |
| N | Annual Revenue Gap | =M × 12 |
Step 6: Build your CTR lookup table.
In a separate tab, create the CTR reference table from Phase 1 above (or the table in the Data section of this post). Use a VLOOKUP or INDEX/MATCH formula in column D to automatically pull the appropriate CTR based on the position in column C. Round positions to the nearest integer for the lookup.
For the AI Overview flag: add a column (let’s call it “AI Overview Present?”) where you mark Y/N for each keyword. Then modify the position 1 CTR formula in column E to return 0.20 when Y and 0.25–0.28 when N. This small adjustment dramatically improves the accuracy of your projections for informational keyword clusters.
Step 7: Sort by Annual Revenue Gap, descending.
This is the most important step. Sort your keyword list by column N (Annual Revenue Gap) from largest to smallest. The top of this list is your SEO investment priority list. These are the keywords where improving your ranking from current position to position 1 delivers the highest financial return. This list should drive your content calendar, your link-building outreach targets, and your on-page optimization sprint schedule.
Phase 3: Validate and Calibrate
Step 8: Sanity-check your model against actual performance.
For keywords where you currently rank at position 1, compare the model’s revenue prediction against what you actually see in revenue attributed to organic search. If the model overestimates by 30%, adjust your conversion rate inputs down. If it underestimates, adjust up. This calibration step is what separates a “strategy deck” tool from a revenue planning tool.
Step 9: Segment your priority keywords by effort.
Revenue gap alone doesn’t tell you which keywords to attack first — you also need to factor in ranking difficulty. Divide your sorted list into three buckets:
- Quick wins: Keywords where you currently rank 2–5, with low-to-medium keyword difficulty. These need on-page optimization and a handful of quality backlinks.
- Medium-term opportunities: Keywords where you rank 6–15, requiring a dedicated content and link-building push over 3–6 months.
- Long plays: Keywords where you rank 16+ or don’t rank yet, requiring new content creation, authority building, and patience.
Step 10: Set monthly tracking cadence.
The calculator is not a one-time exercise. Set a monthly cadence to refresh your ranking data, recalculate the revenue gaps, and measure how your gaps are closing. According to the 2025 B2B SaaS and AI Performance Briefing, average backlink growth is 15–20% annually across competitive SaaS markets — which means your competitors are actively building authority while you plan. A monthly tracking cadence keeps the urgency visible.
Expected Outcomes
After completing this setup, you will have:
– A ranked list of keyword opportunities sorted by revenue potential
– A monthly revenue gap number you can report to leadership (e.g., “$2.1M in annual organic revenue remains uncaptured across our top 40 priority keywords”)
– A prioritized content and link-building roadmap tied directly to financial outcomes
– A model you can update monthly to track progress and reprioritize
Real-World Use Cases
Use Case 1: Agency Pitching a New SEO Retainer
Scenario: A digital marketing agency is pitching an e-commerce client with an average order value of $180 and a site conversion rate of 2.8%. The client currently ranks position 6 for their highest-volume keyword (22,000 monthly searches) and thinks SEO is “too slow.”
Implementation: The agency runs the calculator: current position 6 CTR (~3.5%) generates roughly 770 monthly visits, converting at 2.8% = 22 orders × $180 = $3,960/month. Position 1 CTR (25%) generates 5,500 monthly visits, converting at 2.8% = 154 orders × $180 = $27,720/month. The revenue gap is $23,760/month — or $285,120/year.
Expected Outcome: The agency frames its $4,000/month SEO retainer as a 71× ROI opportunity if position 1 is achieved. The conversation shifts from “SEO is slow” to “what’s our timeline to capture $285K in annual revenue?”
Use Case 2: B2B SaaS Prioritizing Content Investment
Scenario: An in-house SEO manager at a SaaS company needs to justify hiring a content writer. Their median ACV is $24,000 and their demo-to-close rate is 15%, making each qualified lead worth approximately $3,600.
Implementation: She runs the calculator across their top 20 target keywords, finds three keywords where ranking improvements from current positions (7, 9, and 12) to position 1 would yield a combined $1.2M in annual revenue gap. The cost of a content writer is $72,000/year.
Expected Outcome: The hire is approved based on a 16× revenue gap vs. cost ratio. The writer’s roadmap is built directly from the calculator’s priority list rather than editorial intuition.
Use Case 3: SEO Team Adapting to AI Overview Impact
Scenario: An SEO team notices their position 1 rankings are delivering less traffic than historical benchmarks. They suspect AI Overviews are reducing CTR on their informational keywords.
Implementation: They add the AI Overview flag to their calculator model, applying the 20% CTR assumption (instead of 27%) to the 60% of their keywords where AI Overviews regularly appear. The recalculated revenue model shows the total annual gap is $180,000 lower than the original estimate — a meaningful reforecast. Per the 2025 B2B SaaS and AI Performance Briefing, AI Overviews reduce CTR by 15–20%, confirming the adjustment is realistic.
Expected Outcome: The team restructures content to target “zero-click” resistant queries (comparisons, technical how-tos, data-heavy content) where AI Overviews are less prevalent, and pivots 30% of their content budget to these terms.
Use Case 4: Enterprise Comparing Paid vs. Organic Investment
Scenario: A VP of Marketing needs to decide whether to increase paid search budget or invest in SEO infrastructure (technical audit, content, link building). Current CPC for target keywords is $8.50.
Implementation: The calculator shows that position 1 rankings across target keywords would deliver the equivalent of 3,200 monthly organic clicks that currently cost $27,200/month in paid search. SEO infrastructure investment is estimated at $15,000 upfront + $5,000/month ongoing. At month 8 (assuming 6 months to rank), break-even on the SEO investment is achieved, with $22,200/month in net positive ROI thereafter.
Expected Outcome: The VP approves the SEO investment as a paid-search offset strategy, with the calculator output included directly in the board deck.
Common Pitfalls
Pitfall 1: Using a single site-wide conversion rate for all keywords.
The mistake: applying your blended 2% conversion rate to every keyword in the model. The reality: a keyword like “enterprise CRM pricing” converts at 8–12%, while “what is a CRM” converts at 0.1–0.3%. Using a blended rate makes bottom-funnel keywords look less valuable than they are and top-funnel keywords look falsely profitable. Fix: segment conversion rates by keyword intent tier as described in Step 3.
Pitfall 2: Ignoring AI Overview CTR compression.
The mistake: using historical position 1 CTR benchmarks (27–30%) for all keywords without accounting for AI Overview presence. According to the 2025 B2B SaaS and AI Performance Briefing, AI Overviews are already reducing CTR by 15–20% on affected queries. This means revenue projections can be materially overstated. Fix: audit your keyword list for AI Overview presence and apply the adjusted 20% CTR assumption where applicable.
Pitfall 3: Treating the calculation as static.
The mistake: building the model once, presenting it to leadership, and never updating it. Rankings shift, search volumes change seasonally, and competitor activity alters the CTR environment. A stale model produces stale priorities. Fix: set a monthly model refresh cadence and connect the inputs to live rank tracking data where possible.
Pitfall 4: Ignoring site speed as a ranking prerequisite.
The mistake: projecting position 1 revenue without verifying that the site can technically hold a position 1 ranking. Per the 2025 B2B SaaS and AI Performance Briefing, site speed is a “ranking powerhouse” with benchmarks of under 2.5 seconds for mobile and ~1.5 seconds for desktop. A slow site will not hold top rankings regardless of content quality or backlinks. Fix: run a Core Web Vitals audit before investing heavily in content or links, and include site speed remediation in your timeline.
Pitfall 5: Overestimating how fast rankings move.
The mistake: presenting a “we’ll hit position 1 in 90 days” timeline to executives based on the revenue gap calculation, then underdelivering. Rankings for competitive terms take 6–18 months of sustained effort. Fix: present the revenue gap as the opportunity ceiling, not the 90-day forecast. Pair it with a phased timeline that shows incremental position improvements and corresponding incremental revenue capture month by month.
Expert Tips
Tip 1: Build a “revenue per ranking position” ladder for each keyword. Don’t just calculate the gap between current position and position 1 — calculate the revenue value of every intermediate position improvement. This lets you show leadership incremental wins (“we moved from 8 to 5 and captured an additional $4,200/month”) rather than waiting 18 months to claim the full prize.
Tip 2: Cross-reference your top revenue-gap keywords against your paid search spend. If you’re paying for position 1 via PPC on a keyword and the organic revenue gap is significant, that’s your highest-priority SEO target. Winning that organic position allows you to reduce paid spend while maintaining traffic — a double-win. The 2025 B2B SaaS and AI Performance Briefing documents that new customer acquisition costs $2.00 per $1.00 of ARR on average — organic search, once ranked, runs at a fraction of that cost.
Tip 3: Use the calculator output to set SLA-style targets with your content team. Instead of saying “publish 4 posts per month,” say “we need to close the $1.2M annual revenue gap on these 8 keywords within 12 months.” That framing changes how content work gets prioritized and how missed publishing deadlines are understood by the team.
Tip 4: Weight AI Overview-resistant keyword types in your content strategy. Per the 2025 B2B SaaS and AI Performance Briefing, AI Overviews are reducing CTR by 15–20% on affected queries. Content types that are more resistant to AI Overview displacement include: original research, brand comparison pages, interactive tools, and highly specific how-to content with step-by-step specificity. Bias your content roadmap toward these formats for higher CTR capture.
Tip 5: Present the annual revenue gap as a “cost of inaction,” not just an opportunity. Reframe the calculator output: “Every month we remain at position 6 instead of position 1, we leave $23,760 on the table.” This framing creates urgency without requiring optimistic projections — it’s purely mathematical. It also makes the calculator a powerful tool for maintaining executive attention and investment through the slow early months of an SEO program.
FAQ
Q1: What’s the most important input variable in the calculator?
Conversion rate, by far. Search volume and CTR are externally determined — you can look them up and they don’t change based on your choices. But conversion rate is something you control, and a 1% change in conversion rate has a larger impact on the revenue output than moving from position 3 to position 1 on many keyword types. Get this input as accurate as possible by segmenting by keyword intent rather than using a blended site average.
Q2: Should I use the 25% or 20% position 1 CTR in my model?
It depends on the keyword. According to the 2025 B2B SaaS and AI Performance Briefing, the standard position 1 CTR is 25–30%, but this drops to approximately 20% when AI Overviews are prominently featured on the SERP. Check each of your target keywords manually in Google to see whether AI Overviews appear. For B2B technical and commercial keywords, AI Overview prevalence is currently lower than for broad informational queries.
Q3: Can I use this calculator for keywords I don’t currently rank for?
Yes, with an important caveat. For keywords where you have no current ranking, set your current position to 20+ and use the corresponding sub-1% CTR as your baseline. The revenue gap calculation still works — it shows you the full opportunity value of ranking #1 for a new keyword versus zero current contribution. The challenge is that the timeline to reach position 1 from zero is significantly longer than improving from position 5 to position 1.
Q4: How do I handle keywords with very high search volume but low commercial intent?
Apply an appropriately low conversion rate (0.1–0.3% for pure informational keywords) and an honest expected revenue per conversion. High-volume informational keywords often look enormous in the revenue gap calculation until you apply realistic conversion assumptions. Many teams fall into the trap of building content for high-volume terms that will never meaningfully contribute to revenue. The calculator, properly calibrated, exposes this trap before you invest.
Q5: How often should I refresh my revenue gap model?
Monthly is the minimum for active SEO programs. The 2025 B2B SaaS and AI Performance Briefing notes that average backlink growth in competitive markets runs at 15–20% annually, meaning your competitors are continuously building authority. Monthly refreshes ensure your priority list reflects current ranking positions, not three-month-old snapshots. Quarterly refreshes of the conversion rate and transaction value inputs are sufficient.
Bottom Line
The SEO revenue calculator described by Martech.zone (April 2, 2026) solves a fundamental problem: organic search performance has historically been reported in rankings, impressions, and traffic — metrics that don’t translate to board-level budget conversations. By connecting SERP position to a revenue output via CTR curves, conversion rate, and transaction value, the calculator gives SEO practitioners a defensible financial argument for investment and prioritization. The model must account for AI Overview CTR compression — per the 2025 B2B SaaS and AI Performance Briefing, AI Overviews are already reducing position 1 CTR by 15–20% on affected queries, making accurate benchmarking more critical than ever. Build the spreadsheet model, calibrate it against actual performance, sort by annual revenue gap, and use that list as your content and link-building roadmap. The gap between where you rank today and where you could rank is not just a SERP metric — it’s a revenue number your leadership can act on.


0 Comments