Retail marketing teams have more data than ever and fewer answers than they need. According to research compiled in the AI-Driven Brand Strategy and Operational Transformation: 2025 Briefing, global data creation is expected to exceed 180 zettabytes this year — yet 65% of CEOs do not trust their CMOs to prove that marketing spend drives revenue and EBITDA. This tutorial gives you the exact architecture, toolset, and 90-day implementation roadmap to close the gap between data abundance and real decision intelligence.
What This Is
The “insight paradox” is the defining operational challenge for retail marketing in 2026. Your organization is generating more customer data than ever before — from point-of-sale systems, loyalty programs, e-commerce event logs, CRM platforms, social channels, and paid media — and yet the dominant experience for most retail marketing teams is still the same: hours lost pulling reports, decisions made on data that’s 30 to 90 days stale, and dashboards that describe what already happened rather than what’s about to.
According to Martech.Zone’s analysis of the retail AI gap, the issue isn’t capability — it’s context. AI has the analytical horsepower to process these data volumes. The problem is that most retail organizations have not built the structural infrastructure to let AI operate on unified, real-time data. Instead, AI tools are layered onto siloed, disconnected stacks, producing outputs that are fragmented, contradictory, and hard to act on.
This is not a technology problem in the narrow sense. As Transparent Partners articulated in their “AI-Ready Marketing Tech Stack” analysis, cited in the research report: “AI doesn’t demand more marketing technology; it demands better marketing architecture.” That distinction is the entire premise of this tutorial. Adding more analytics tools to a broken stack doesn’t produce insight — it produces noise with higher overhead.
What retail marketers are dealing with is a structural failure of their analytics infrastructure. Customer data lives in CRM platforms, loyalty systems, POS records, e-commerce logs, social listening tools, and paid media platforms. Each generates signals independently. Most organizations have no mechanism to unify those signals into a coherent picture of a single customer, a single market trend, or a single demand forecast. The result: marketing decisions are made on lagging, siloed, context-free data, and the C-suite — which is evaluating margin, pipeline, and velocity — loses confidence in marketing’s ability to drive business outcomes.
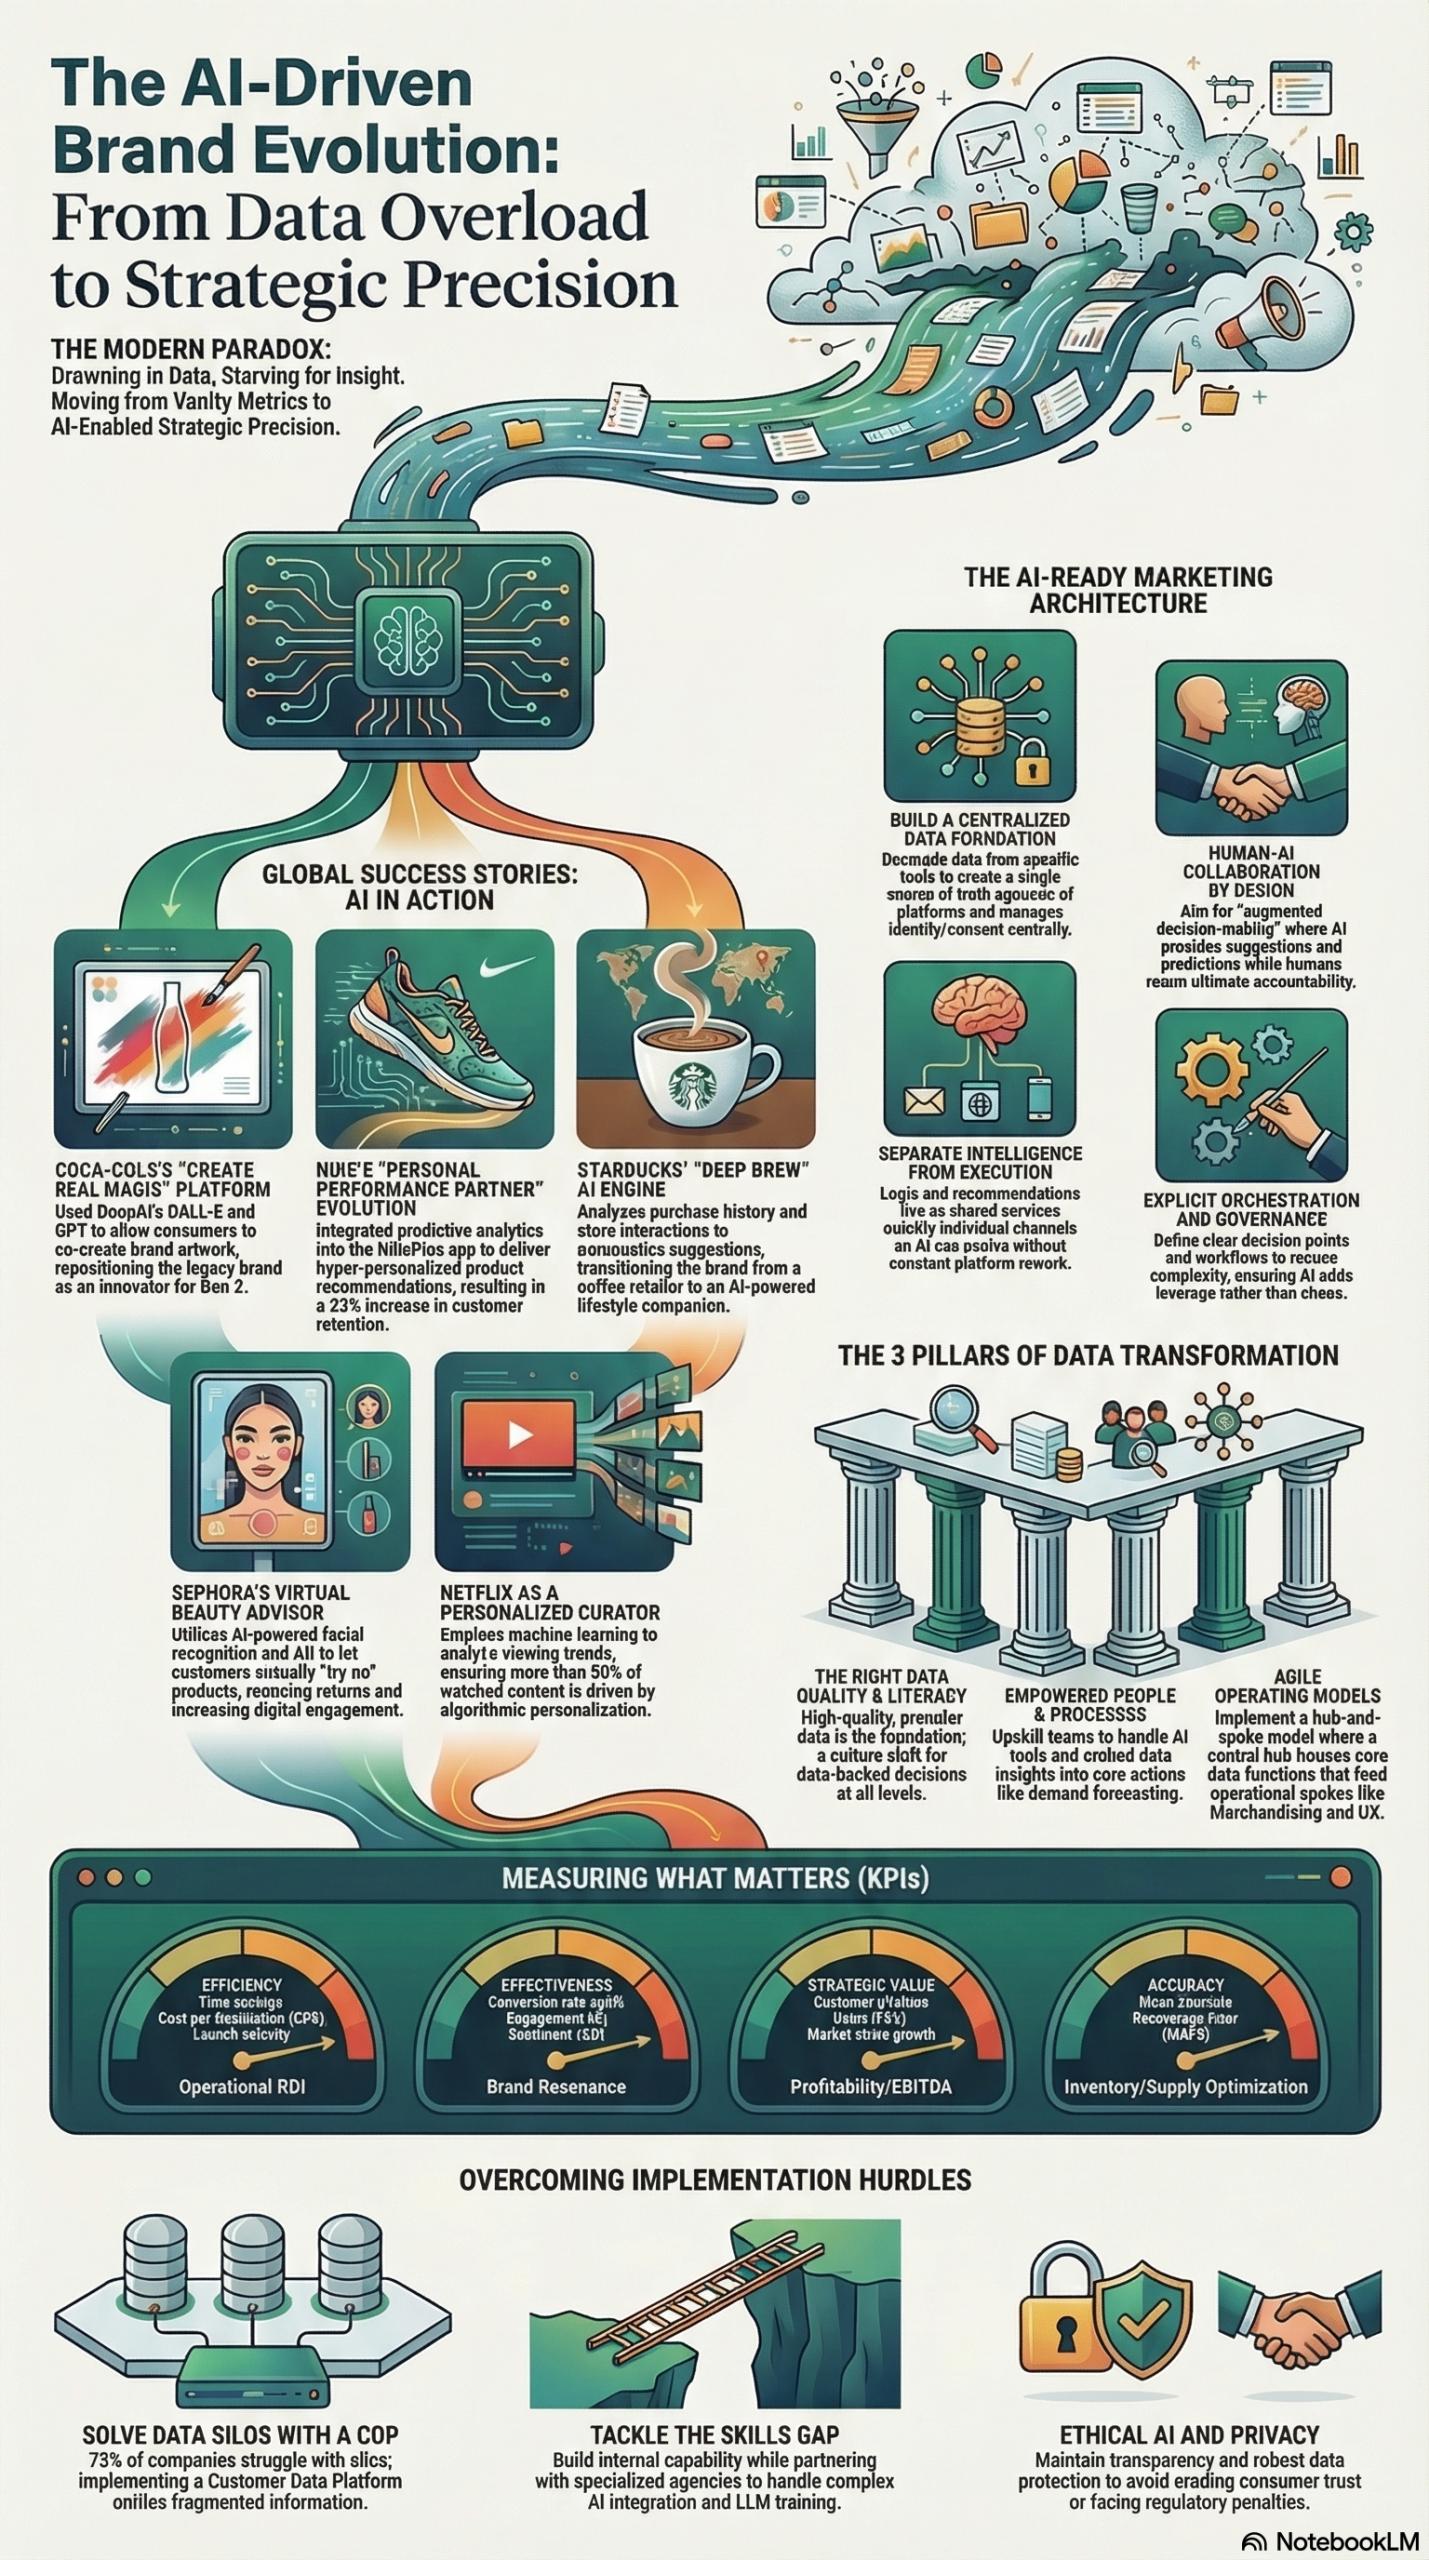
The solution this post teaches is what practitioners now call an AI-ready marketing architecture: a modular, data-centric system in which customer intelligence is treated as a shared enterprise asset rather than a departmental output. It is built on three structural commitments:
- A centralized data foundation — typically a Customer Data Platform (CDP) — that unifies customer identity across all touchpoints.
- An intelligence separation layer that decouples AI decision logic (models, rules, predictions) from the execution channels that act on those decisions.
- Explicit orchestration of signals and decision points, making the connection between marketing activity and business outcomes visible, auditable, and improvable.
This is the same architectural posture that has enabled Nike, Starbucks, Sephora, Netflix, and other leading retail brands to move from reactive campaign execution to predictive, personalized engagement. It is not a single product you can buy — it is a system you build deliberately, one integration at a time. The 90-day roadmap in this post shows you exactly how to start.
Why It Matters
The stakes for retail marketers failing to close this gap are concrete and immediate. According to the research report, commercial retail entities currently lose approximately 3% of annual profits to out-of-stock conditions alone — a direct consequence of poor demand forecasting, which is itself a direct consequence of siloed, lagging data. AI-improved demand forecasting can reduce forecasting errors by 30–50%, reduce lost sales by up to 65%, and decrease inventory carrying costs by 20%. These are not aspirational benchmarks — they are documented outcomes from organizations that have implemented AI-ready architectures.
But the impact extends beyond operational efficiency into organizational credibility. The Alvarez & Marsal finding — that 65% of CEOs don’t trust their CMOs, as cited in the research report — is not a communication problem. It’s a measurement infrastructure problem. Marketing leaders who cannot connect campaign activity to margin, pipeline, or velocity are functionally invisible in a boardroom focused on EBITDA. AI-driven insight architecture changes this by making the connection between marketing signals and business outcomes explicit, automated, and auditable. When you can show Finance a direct line from a demand sensing signal to an inventory reorder decision to a reduction in stockout-related lost sales, you have a credibility conversation instead of a trust gap.
For practitioners specifically, the shift creates three new operational capabilities that did not exist with traditional analytics:
Real-time demand sensing: Instead of monthly or weekly sales reports, you get daily or near-daily signals from POS sell-through rates, social sentiment volume, and search trend data — allowing inventory and campaign adjustments before a demand peak or trough crests.
Hyper-personalized customer journeys: Rather than audience segments of thousands, AI personalization engines like Dynamic Yield or Adobe Sensei can customize offers, content, and product recommendations at the individual level, in real time, based on unified customer profiles.
Predictive churn and retention modeling: By integrating loyalty data, purchase history, and behavioral signals into a unified profile, AI can flag at-risk customers before they defect — enabling proactive retention campaigns that cost a fraction of new customer acquisition.
What makes this moment different from previous AI hype cycles is that the tools, the data volumes, and the organizational pressure to perform are all converging simultaneously. The retail organizations building AI-ready architecture now are opening an operational gap over competitors that will be difficult to close in two or three years.
The Data
The following table compares documented outcomes from traditional marketing analytics versus AI-driven insight architecture, based on benchmarks and case studies in the research report:
| Metric | Traditional Analytics | AI-Driven Architecture | Improvement |
|---|---|---|---|
| Demand Forecasting Error Rate | High variance, monthly lag | 30–50% reduction in error | Significant |
| Lost Sales from Stockouts | ~3% of annual profit lost | Up to 65% reduction | High |
| Inventory Carrying Costs | Baseline (excess stock) | Up to 20% reduction | Moderate-High |
| Customer Retention (Nike NikePlus) | Baseline | +25% increase | High |
| Repeat Purchases (Sephora) | Baseline | +15% increase | Moderate |
| User Growth (Temu AI personalization) | Baseline | +30% increase | High |
| CEO Trust in CMO Performance | 35% trust | Improves with proof-of-ROI | Critical gap |
AI Tool Capability Matrix for Retail Marketing:
| Capability | Recommended Tools | Primary Use Case |
|---|---|---|
| Predictive Analytics | IBM Watson, RapidMiner | Market trend forecasting, demand modeling |
| Sentiment Analysis | Brandwatch, Talkwalker | Brand perception shifts, demand signals |
| Personalization Engines | Dynamic Yield, Adobe Sensei | Tailored product recommendations |
| Site & Demand Scoring | GrowthFactor’s Waldo | AI-powered retail location and demand scoring |
| Customer Data Platform | Salesforce Data Cloud | Identity resolution, data activation |
Source: AI-Driven Brand Strategy and Operational Transformation: 2025 Briefing
Step-by-Step Tutorial: Building an AI-Ready Retail Marketing Architecture in 90 Days
This walkthrough is structured around the 90-day action plan framework from the research report. It is designed for a retail marketing director or senior marketing manager with access to their current martech stack and authority to run a pilot program. You don’t need a greenfield implementation — you need a structured approach to retrofitting what you have and building what you don’t.
Prerequisites
Confirm you have the following before starting:
- Access to at least two customer-facing data sources (CRM, POS system, e-commerce platform, or loyalty program)
- A Customer Data Platform (CDP) already in place, or a budget and timeline to evaluate one — Salesforce Data Cloud is the enterprise benchmark; Segment, mParticle, and BlueConic are strong mid-market options
- Executive sponsorship — specifically, alignment with your CFO or VP Finance on what shared KPI definitions will look like
- A defined pilot scope: one customer segment, one product category, or one geographic region where you have clean, complete data
- A baseline measurement for your pilot hypothesis — stockout rate, churn rate, repeat purchase rate, or demand forecast accuracy, depending on your focus
Do not skip the prerequisites. The most common reason AI retail pilots fail is that they launch without unified data, without an executive sponsor, or without a pre-defined success metric.
Phase 1: The KPI Reset (Days 1–30)
The first and most important phase has nothing to do with technology. It is about retiring the metrics that insulate marketing from accountability and replacing them with metrics the business actually cares about.
Step 1: Audit your current reporting against business outcomes.
Pull your last 90 days of marketing reports. For every metric you currently track — impressions, email opens, click-through rates, MQLs, social followers — ask a single question: Does this metric directly connect to pipeline, margin, or revenue velocity? If you cannot draw a direct, auditable line, that metric does not belong in your executive reporting. It can remain an operational diagnostic, but it cannot be the story you tell leadership.
Be ruthless here. Impressions tell the board nothing about gross margin. Open rates do not predict stockouts. The Alvarez & Marsal research puts the problem plainly: “Too many marketing leaders still show up with vanity numbers — clicks, impressions, leads — that the board couldn’t care less about.” The KPI reset is how you stop being that leader.
Step 2: Build a shared KPI dictionary with Finance and Sales.
Schedule a working session — not a presentation, a working session — with your CFO or VP Finance and your VP or Head of Sales. The deliverable is a single shared document that defines: (a) which specific marketing activities are expected to drive which revenue outcomes, (b) the agreed attribution windows for measuring that connection (7-day last-click, 30-day multi-touch, etc.), and (c) which data system is the authoritative source of truth for each metric.
This alignment step is non-negotiable. Without it, your AI pilot will produce numbers that Marketing believes and Finance disputes. With it, you have a pre-agreed framework that makes your pilot results credible before you even run the campaign. This is the mechanism by which marketing leaders rebuild C-suite trust.
Step 3: Write your pilot hypothesis as a single measurable sentence.
The hypothesis format is: “If we [specific AI-driven action], we expect [specific business outcome] to improve by [measurable amount] within [defined timeframe].”
Example A: “If we implement AI-powered demand sensing for our top 50 SKUs in the Northeast region, we expect stockout events to decrease by 20% within 60 days.”
Example B: “If we deploy AI-driven cross-sell recommendations to loyalty members who haven’t purchased in 45 days, we expect reactivation rate to increase by 15% within 30 days.”
The specificity of this sentence is what makes your results credible and your methodology defensible when you present to leadership at day 90.
Phase 2: Stack Simplification and Data Unification (Days 31–60)
Step 4: Map your existing martech stack against what data each tool generates and consumes.
Create a simple spreadsheet with every tool your team uses. For each tool, document three things: (a) what data it generates or ingests, (b) where that data currently lives (in the tool’s database, in a data warehouse, or nowhere accessible), and (c) which other systems it connects to today. You will almost certainly discover: duplicate capabilities across tools, data that is generated but never used, and critical gaps where two systems that should share data have no integration.
This inventory is the prerequisite for simplification. Most retail marketing stacks have grown through vendor accumulation — each tool solving a problem in isolation, with no one ever auditing the aggregate. The Transparent Partners framework explicitly calls out “stack simplification” as a Phase 2 priority because the cost of maintaining disconnected tools is not just financial — it’s architectural. Every silo is a ceiling on what AI can do.
Step 5: Configure your CDP as the centralized data foundation.
The architecture goal is a single hub that unifies customer identity across all your data sources. In practice, this means your CDP must do three things:
- Ingest: Pull data from all customer-facing systems (POS, CRM, e-commerce, loyalty program, email) — either via native connectors, API integrations, or data warehouse sync.
- Resolve: Match the same customer across channels. A customer who buys in-store with a loyalty card, browses your website as a logged-in user, and opens your promotional emails should be recognized as a single unified profile, not three separate records.
- Activate: Push those unified profiles — and the AI-generated attributes and scores built on top of them — to your execution channels: your email platform, your ad platforms, your on-site personalization engine.
If you are using Salesforce Data Cloud, this means configuring Data Stream connectors for each source system, running identity resolution rules to merge duplicate profiles, and defining Unified Individual objects that your marketing automation and personalization tools consume. Other enterprise CDPs follow equivalent patterns. The configuration timeline is typically 30–45 days for 2–4 source systems.
Step 6: Separate your intelligence layer from your execution channels.
This is the “intelligence separation” principle from the research report, and it is the architectural decision with the highest long-term leverage. Your AI models — recommendation logic, churn predictions, demand forecasts, segment definitions — should not live inside your email platform, your ad platform, or any single execution tool. They should live in a dedicated intelligence layer that sits above your execution tools and exposes its outputs via APIs or audience activations.
Why does this matter? Because when your recommendation model improves, you want to deploy the improvement everywhere simultaneously — email, on-site, app, in-store display — without rebuilding five different campaign configurations. The intelligence layer is the single point of update; the execution channels are interchangeable consumers.
In practice, build your segmentation and personalization logic in your CDP or a dedicated AI tool (Dynamic Yield, Adobe Sensei, or a Python-based ML pipeline if you have data science resources). Define clean API endpoints or audience export schemas, and configure your execution tools to consume those outputs rather than managing their own segmentation logic.
Step 7: Stand up demand sensing for your pilot category.
Demand sensing is the practice of using near-live signals to adjust short-term demand forecasts on a daily basis, rather than waiting for weekly or monthly reporting cycles. According to the research report, demand sensing is particularly effective for fast-moving consumer goods and any retail category where demand is influenced by external signals like weather, search trends, or social sentiment.
The signals to aggregate for your pilot category:
– SKU-level daily POS sell-through rates — your actual demand signal, pulled from your POS system or data warehouse on a daily cadence
– Google Trends data for your category’s primary search terms — available via the Google Trends API or through tools like GrowthFactor’s Waldo
– Social sentiment volume for relevant keywords — Brandwatch and Talkwalker both provide API access to near-real-time volume and sentiment data
– Local weather data if your category is weather-sensitive (apparel, beverage, outdoor products) — available via commercial weather APIs
In Phase 2, the goal is not automation — it’s visibility. Build a simple dashboard (a Google Data Studio or Tableau view connected to these sources is sufficient) that shows daily sell-through versus baseline forecast for your pilot SKUs, alongside the external signals. The discipline of reviewing this daily, and making human decisions faster as a result, is itself valuable before you automate a single decision.
Phase 3: Execute, Measure, and Present ROI (Days 61–90)
Step 8: Run your defined pilot project.
With unified data in your CDP and demand sensing visibility established, execute the specific AI-driven initiative from your pilot hypothesis. The three highest-ROI pilots for retail, based on documented benchmarks in the research report:
AI-powered cross-sell and upsell: Use purchase history data in your CDP to generate personalized product recommendations. Trigger these recommendations via email (to lapsed purchasers or post-purchase follow-up), on-site (logged-in browse sessions), or app (push notification). Dynamic Yield and Adobe Sensei provide pre-built recommendation engines with CDP connectors. Expected lift: 15–30% in repeat purchase rate, depending on category and recommendation quality.
Predictive churn intervention: Use loyalty data, purchase recency, and behavioral engagement scores to identify customers at elevated churn risk — typically defined as customers who have purchased within the last 90 days but show declining engagement signals. Trigger a targeted retention offer (exclusive discount, loyalty point bonus, or personalized product feature) before they defect. Retention cost is typically 5–7x lower than new customer acquisition cost, making this one of the highest ROI AI applications in retail.
Automated inventory rebalancing alerts: Wire your demand sensing dashboard to generate alerts when a SKU’s daily sell-through rate deviates more than a defined threshold (15–20%) above or below your baseline forecast. Route these alerts to your inventory or buying team for same-day review. This is the entry point to the kind of demand forecasting improvement — 30–50% error reduction — documented in the research report.
Step 9: Compile and present your results in the language of business outcomes.
At day 90, your results presentation should contain exactly three numbers: (a) the revenue or cost impact of the pilot in dollar terms, (b) the improvement in a data accuracy metric (forecast error reduction, churn rate reduction, repeat purchase rate increase), and (c) the projected annual value of scaling the pilot to your full catalog or customer base.
Present these numbers against the baseline you established in Step 3 (your pilot hypothesis). If your hypothesis was specific and your baseline was documented, your results are credible and defensible. This is how you change the C-suite trust conversation.
Step 10: Define your Phase 2 expansion scope.
If your pilot succeeds — even partially — you now have organizational proof to justify broader investment. Phase 2 means extending AI across your full customer base, integrating personalization across all channels simultaneously, and building toward the omnichannel intelligence model documented in the research report: where physical and digital channels share the same unified customer intelligence layer, as Sephora has demonstrated with its Virtual Artist cross-channel data strategy.
Expected Outcomes at 90 Days
By the end of a disciplined 90-day implementation:
– A unified customer data foundation is live, replacing at least two previously siloed data sources
– Demand sensing visibility is operational for your pilot product category
– At least one measurable AI-driven pilot has been executed with documented business outcome metrics
– You have a credible, Finance-aligned ROI presentation ready for Phase 2 budget discussion
– Your team has hands-on experience with the infrastructure that scales to full deployment
Real-World Use Cases
Use Case 1: Nike — Predictive Retention Inside a Loyalty Ecosystem
Scenario: Nike’s NikePlus membership program generates behavioral data across fitness tracking, app usage patterns, training history, and purchase records — a multi-dimensional customer profile that traditional CRM systems cannot utilize.
Implementation: Nike integrated predictive AI within the NikePlus ecosystem to analyze individual fitness goals, training cycles, and purchase history simultaneously. The AI layer generates personalized product recommendations and engagement prompts timed to each user’s training context — surfacing running shoe recommendations ahead of a training peak, or recovery product offers after high-intensity training blocks.
Expected Outcome: According to the research report, this approach delivered a 25% increase in customer retention — a direct result of repositioning Nike’s identity from product manufacturer to individualized “performance partner.” The retention improvement translates directly to reduced acquisition spend and higher customer lifetime value.
Use Case 2: Starbucks — Deep Brew AI for Real-Time Contextual Personalization
Scenario: Starbucks operates thousands of locations across diverse geographies, serving customers whose ordering preferences are influenced by weather, time of day, location, and personal habit — variables that static loyalty program segmentation cannot capture at scale.
Implementation: The “Deep Brew” AI engine, documented in the research report, personalizes drink and food suggestions in real time based on a live combination of signals: current weather at the customer’s nearest store, time of day, location context, and full individual purchase history. These suggestions are surfaced in the mobile app at order time and at drive-through digital display screens.
Expected Outcome: Starbucks shifted from a coffee retailer identity to what the research describes as an “AI-powered lifestyle companion,” while simultaneously reducing inventory waste through demand-signal-informed replenishment. The personalization layer drives both revenue per transaction and inventory efficiency simultaneously.
Use Case 3: Sephora — Cross-Channel Intelligence Bridging Digital and Physical
Scenario: Sephora’s core challenge was the gap between digital product discovery — customers experimenting with products virtually through the app — and physical store conversion, where customers couldn’t easily find the specific products they’d already tried digitally.
Implementation: Sephora’s “Virtual Artist” app uses facial recognition to enable virtual product try-ons across their full makeup catalog. The critical architectural decision: the try-on data is shared across channels. A customer who virtually tests a specific foundation shade can walk into any Sephora physical store and immediately access that product recommendation through store associates or in-store digital displays. The intelligence layer is unified; the channels are different delivery surfaces.
Expected Outcome: The research report documents a 15% increase in repeat purchases attributable to this cross-channel intelligence strategy. The mechanism is friction reduction: when the gap between digital intent and physical fulfillment disappears, purchase completion rates rise.
Use Case 4: Temu — Aggressive AI Personalization to Capture Market Share
Scenario: Temu entered competitive retail markets against established players with deeper brand equity, larger catalogs, and existing customer loyalty — a position where standard marketing could not overcome the incumbency advantage.
Implementation: Temu invested heavily in AI-driven personalization and gamification within its app, using behavioral data to continuously refine each user’s product feed in real time, and layering game-like engagement mechanics (daily deals, streaks, rewards) that increase session depth and purchase frequency. The AI stack continuously A/B tests personalization variables at individual scale.
Expected Outcome: According to the research report, Temu achieved a 30% increase in user growth and significant market share expansion in competitive territories. The growth was driven almost entirely by AI-powered personalization infrastructure rather than brand investment — a signal that personalization architecture can substitute for brand equity in highly price-competitive retail categories.
Use Case 5: Mid-Market Apparel Retailer — Demand Sensing for Seasonal Category Optimization
Scenario: A regional apparel retailer with 40 locations consistently over-orders winter coats (resulting in end-of-season markdowns) and under-orders transitional weather items (resulting in stockouts during shoulder seasons). Both failures stem from the same root cause: monthly demand forecasts that cannot respond to real-time seasonal signals.
Implementation: The retailer implements a demand sensing workflow using three data sources: Google Trends API data for seasonal search volume on relevant apparel terms, local weather API feeds for 14-day temperature forecasts across their store regions, and daily SKU-level POS sell-through pulled from their retail management system. A simple dashboard surfaces daily sell-through deviation from forecast for a 200-SKU pilot. Any SKU deviating more than 15% above or below forecast triggers a same-day buyer review.
Expected Outcome: Based on documented benchmarks in the research report, the team projects a 30–50% reduction in demand forecasting error for the pilot category and meaningful recovery of the ~3% annual profit loss attributable to stockout conditions. The methodology scales to full catalog in Phase 2.
Common Pitfalls
Pitfall 1: Layering AI onto a broken, siloed stack.
The most common and costly failure mode is purchasing an AI analytics or personalization tool and connecting it to existing siloed data sources without first unifying them. The AI will produce outputs — but those outputs will be as fragmented and contradictory as the inputs. A churn model trained on email data alone will miss in-store behavioral signals. A demand forecasting model that can’t see loyalty data will misread true demand. Fix: complete CDP implementation and identity resolution (Step 5) before deploying any AI model that depends on cross-channel data. Unified data is the prerequisite, not the destination.
Pitfall 2: Measuring marketing outputs instead of business outcomes.
Teams that define their AI pilot’s success as “email open rate improved by 8%” are measuring the wrong thing and will lose the C-suite conversation. As the Alvarez & Marsal research documents, CEOs are evaluating EBITDA and margin — not engagement rates. Fix: complete the KPI Reset (Phase 1, Steps 1–2) before launching any AI initiative. Every pilot must have a pre-defined business outcome metric — revenue impact, cost reduction, churn rate decrease — that is agreed with Finance before the pilot runs.
Pitfall 3: Treating AI models as static implementations.
AI models trained on historical data degrade over time as consumer behavior, seasonality, and market conditions shift. A demand forecasting model trained on 2023 purchase patterns may perform poorly against 2026 consumer behavior. Fix: build scheduled model retraining into your operational calendar — at minimum quarterly — and instrument your models to continuously compare predictions against actual outcomes, triggering retraining when accuracy falls below a defined threshold.
Pitfall 4: Ignoring algorithmic bias in personalization.
AI personalization and segmentation models can systematically amplify biases present in historical data. A model trained primarily on your highest-spending customers’ behavior may under-serve new customers with high potential by treating them as low-priority segments. As the research report identifies, addressing bias requires “a balanced approach with robust human oversight.” Fix: build a monthly audit of AI-generated segment definitions and recommendation distributions into your operations. Review whether your AI recommendations are systematically excluding or underserving specific customer groups.
Pitfall 5: Outsourcing all AI expertise to vendors.
Marketing teams that rely entirely on external vendors for AI implementation lose the institutional knowledge needed to iterate, optimize, and expand. When the vendor relationship ends or the vendor changes their platform, the organization is left unable to operate what it built. The research report explicitly identifies the skills gap as a primary AI adoption challenge and recommends combining internal capacity building with external partnerships. Fix: ensure at least one internal team member is trained on your CDP configuration and your primary AI tool’s logic, not just its outputs.
Expert Tips
Tip 1: Build your intelligence layer above your execution channels, not inside them.
This is the single highest-leverage architectural decision you can make before scaling. If your recommendation logic lives inside your email platform, it can’t power your ad platform, your on-site experience, or your in-store digital displays — you’d have to rebuild it in each channel separately. Build your AI logic in a neutral, channel-agnostic layer (your CDP or a dedicated AI orchestration tool) and expose it as a shared service. This is how Sephora runs the same customer intelligence across virtual try-on, app, and physical stores simultaneously.
Tip 2: Match your forecasting method to your forecast horizon.
The research report distinguishes three forecasting approaches — quantitative (time-series), qualitative (expert judgment), and hybrid — and notes that demand sensing is most effective for 1–14 day forecast horizons on fast-moving SKUs. For 90-day and longer planning horizons, hybrid models that combine statistical baselines with expert scenario inputs outperform pure quantitative approaches because near-live signals are less predictive of longer-term trends. Use the right tool for the right horizon; don’t force a single methodology across all time windows.
Tip 3: Run your first AI pilot on your cleanest data, not your most important category.
The instinct is to pilot AI on your highest-revenue category where the ROI potential is largest. Resist this. Start with the category where your data is most complete, most consistent, and most trustworthy. A successful pilot in a clean-data category builds organizational credibility, surfaces data quality issues you’ll need to solve before scaling, and produces results you can defend. A failed pilot in your most important category — even if it fails for data quality reasons — erodes the organizational trust you need for Phase 2.
Tip 4: Define your ROI measurement methodology before the pilot launches, not after.
Don’t wait until day 89 to think about how you’ll present your results. Define your measurement methodology — the specific baseline numbers, the attribution approach, the comparison period — before you launch the pilot. Document it and share it with your Finance partner in advance. This protects you from retrospective reframing of results and gives your findings credibility before anyone sees the numbers.
Tip 5: Treat data governance as a prerequisite, not a compliance afterthought.
The Transparent Partners framework describes “agile governance” — pre-defined standards for data usage, ethics, and accountability that accelerate progress by removing case-by-case negotiations every time a new use case is proposed. Establish your data usage policies, consent management standards, and privacy compliance requirements before your CDP goes live. Most enterprise CDPs (Salesforce Data Cloud, Segment, mParticle) have built-in consent management modules — configure them at implementation, not after a compliance question surfaces six months later.
FAQ
Q: How long does it realistically take to implement a CDP for a mid-size retail organization?
A basic CDP implementation with two to three data source connectors and identity resolution configured takes 60–90 days in practice. Full activation across all channels and use cases — meaning every execution platform consuming unified customer profiles — typically takes 6–12 months. The 90-day framework in this tutorial is designed to get you to a measurable pilot result within your first implementation phase, not full organizational scale. Plan your pilot scope accordingly: one category, one segment, one region.
Q: Do we need to replace our existing marketing tools to build an AI-ready stack?
Not necessarily. The “intelligence separation” principle from the Transparent Partners analysis means your existing execution tools — your email platform, your ad platforms, your analytics dashboards — can often remain in place. What changes is the intelligence layer that feeds them. Your CDP and AI models sit above your existing tools, pushing unified signals and audience activations down into them. The existing tools become consumers of better intelligence rather than generators of siloed intelligence.
Q: What is the minimum data requirement for AI demand sensing to produce actionable results?
Demand sensing requires SKU-level daily sell-through data. If your current POS reporting runs on a weekly or monthly cadence, you’ll need to change your data pipeline — pulling daily rather than batching — before demand sensing adds operational value. The minimum viable dataset for a demand sensing pilot is: SKU-level daily sales volume for your pilot category, at least six months of historical data to establish baseline patterns, and at least one external signal source (weather API, Google Trends, or social volume). Weekly or monthly data cannot support daily forecast adjustment, which is the core value of demand sensing.
Q: How do we close the CEO trust gap without waiting for a full AI implementation?
Start immediately with the KPI Reset (Phase 1, Steps 1–2), which requires zero technology investment. Retiring vanity metrics and establishing a shared KPI dictionary with Finance and Sales is an organizational change you can make this week. Present this KPI alignment framework to your CEO or CFO as the foundation for your AI investment case: “Here is how we are redefining what success means for marketing, and here is the infrastructure investment that will let us measure it.” The framework demonstrates strategic accountability before the technology is built.
Q: How do we handle customer data privacy when unifying data across channels into a CDP?
The research report identifies privacy and bias as key implementation challenges requiring “robust human oversight and ethical training.” In practice, your CDP must comply with GDPR, CCPA, and applicable regional privacy regulations from day one of implementation — not retrofitted after the fact. This means: proper consent management configured at launch (most enterprise CDPs have built-in consent modules), documented data retention and deletion policies with automated enforcement, and audit logs that can demonstrate which data was used for which AI model. Do not unify customer data first and address compliance later. Configure your consent and governance framework before you activate any cross-channel data flows.
Bottom Line
Retail marketers are not failing because they lack data — they are failing because their architecture does not convert data into decisions. The path forward is not more tools; it is better architecture: a centralized data foundation, an AI intelligence layer that sits above execution channels rather than inside them, and a KPI framework that connects marketing activity to the business outcomes Finance and the CEO actually measure. The 90-day roadmap in this post — KPI Reset, Stack Simplification, Pilot Execution — is designed to take you from data overload to documented ROI within a single quarter, using the infrastructure you can start building now. The brands that have committed to this architectural posture — Nike, Starbucks, Sephora, Netflix — are seeing 15–30% improvements in retention, repeat purchase rates, and user growth, documented in the research report. The insight paradox doesn’t close automatically. You have to build the system that closes it.


0 Comments