Your marketing report shows traffic up, ROAS on target, and rankings climbing — and none of it is telling you whether marketing is actually growing the business. According to Neil Patel’s analysis of modern marketing measurement, the numbers that look best are often the ones least connected to actual business growth. This tutorial walks you through exactly how to audit your current metrics, identify what’s misleading you, and rebuild your measurement stack around causality instead of activity.
What This Is: The Collapse of Traditional Marketing Measurement
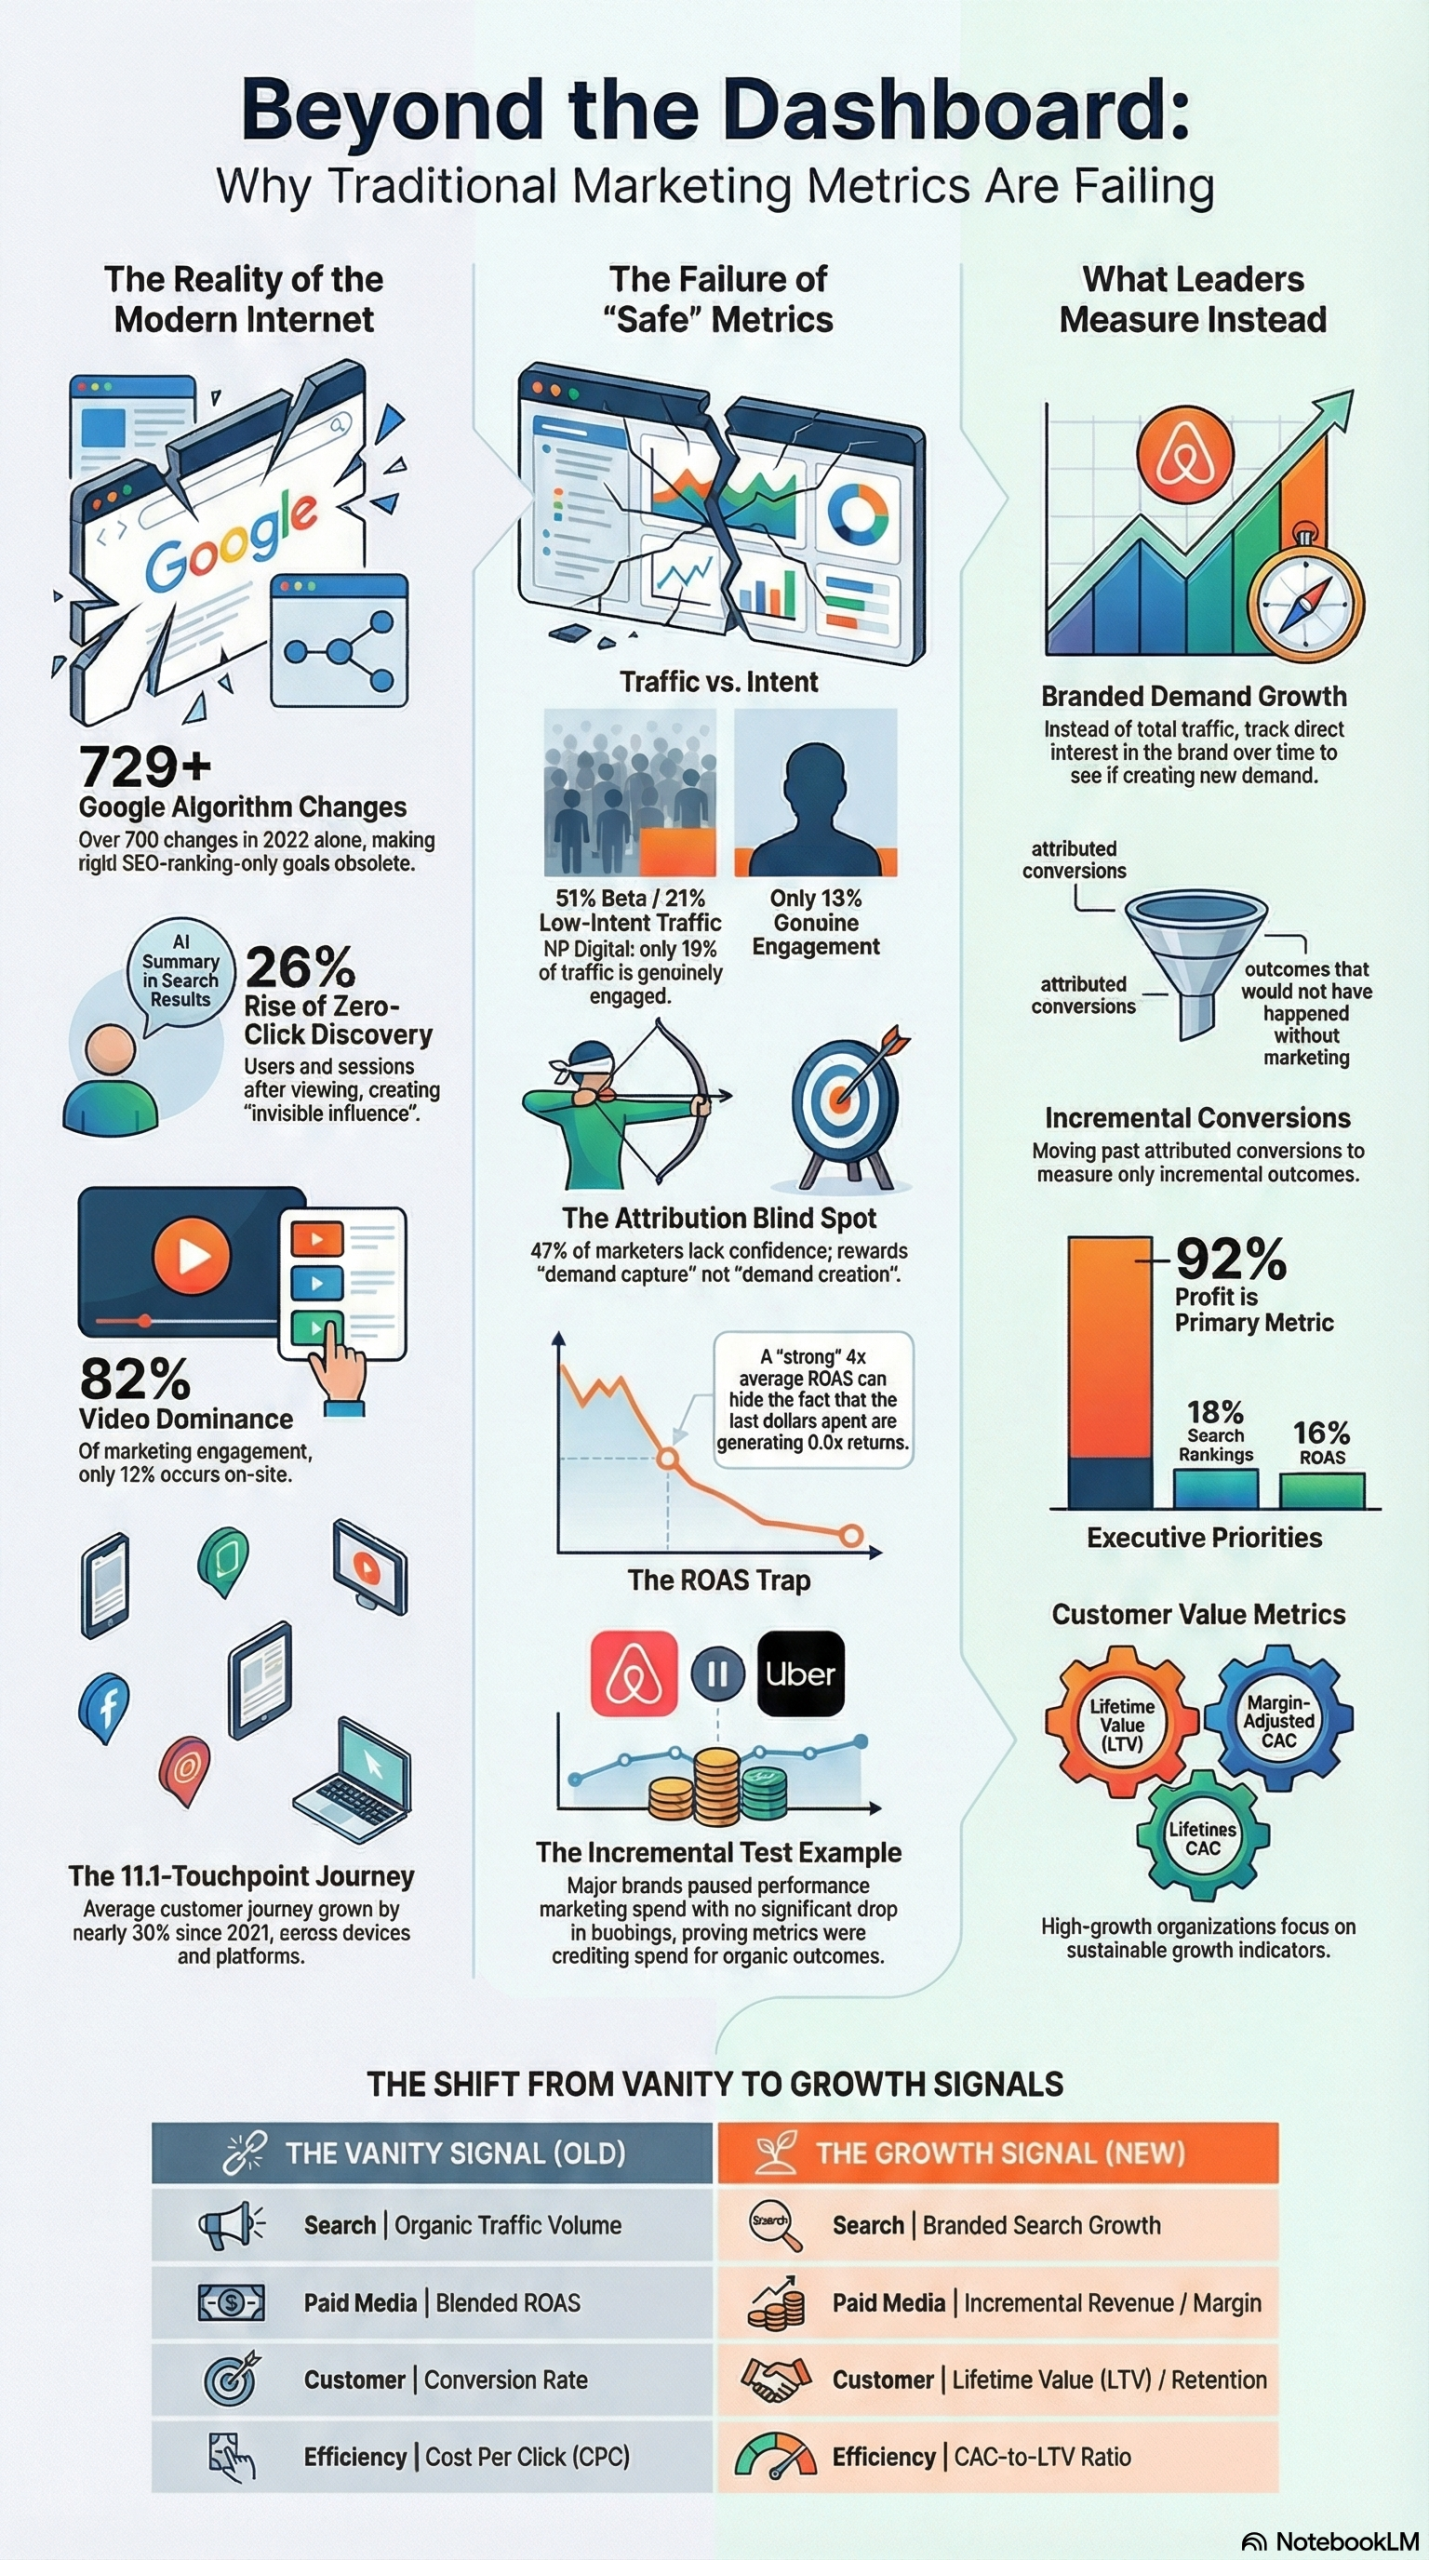
The metrics most marketing teams report on every week — organic traffic, search rankings, Return on Ad Spend (ROAS), click-through rate, cost-per-click — were designed for a different internet. They made sense when user journeys were linear, sessions were desktop-based, and Google was the only discovery engine that mattered. That internet is gone.
According to the NotebookLM research report on modern marketing measurement, the average customer journey expanded from 8.5 touchpoints in 2021 to 11.1 in 2025, with 90% of users now switching between devices and platforms before converting. What that means in practice: the metrics your team tracks are capturing fragments of a journey, not the full picture, and those fragments are being misread.
Zero-Click Discovery Has Broken Traffic Reporting
Search behavior is rapidly shifting toward AI-generated summaries and featured snippets that answer queries directly on the SERP. The research report documents the specific mechanics: users who encounter AI summaries click through to websites at roughly half the rate of users viewing standard results. More telling, approximately 26% of users end their session entirely after viewing an AI summary, compared to 16% for standard results. Your organic traffic numbers are going down not because your SEO is failing, but because the SERP is answering the question for your audience — and brands can influence buyers through AI-cited content without that influence ever appearing in a traffic dashboard.
Discovery Has Moved Off Your Website
The data from Neil Patel’s blog and the research report paints a clear picture of where marketing engagement actually happens: 82% of marketing engagement occurs via video, SERP and AI answers account for 79% of engagement, and only 12% happens on-site. Buyers are evaluating your brand on YouTube, LinkedIn, and AI engines long before they ever visit your website — meaning the on-site analytics you’ve built your reporting around are missing the majority of your marketing’s actual reach.
Your Traffic Itself Has Changed
A study of 602 websites referenced in the research report found that 51% of all web traffic is bot traffic, 21% is short sessions (users who leave within seconds), and only 16% qualifies as genuinely engaged traffic. If you are optimizing campaigns to drive traffic volume, you are likely optimizing for the wrong 84%.
This is not a failure of your analytics platform. It is a structural mismatch between the measurement frameworks built for 2015 and the customer reality of 2026.
Why It Matters: The Executive Disconnect Is Costing You Budget
The gap between what marketing teams report and what executives actually want to know is documented and quantifiable. According to the research report, 92% of marketers say profit is a primary metric, yet many teams still anchor their reporting around search rankings — a metric valued by only 18% of executives.
The consequence is predictable: marketing teams defend budgets using evidence executives do not find meaningful. When a VP of Finance asks whether paid media is generating incremental revenue or just capturing demand that would have converted anyway, a ROAS number does not answer that question. It just measures the ratio of ad spend to attributed revenue — and attribution models, as the research makes clear, are designed to track what happened, not what caused it to happen.
Who Gets Hurt Most
- Performance marketing managers who optimize toward attributed conversions and ROAS targets are the most exposed. The platform’s algorithms are designed to find users already likely to convert, which means the channel takes credit for outcomes that would have happened regardless of the ad.
- SEO teams whose success metric is keyword rankings are reporting against a measure that 82% of executives do not prioritize. Meanwhile, the actual brand presence in AI-generated answers is going unmeasured.
- Agencies presenting monthly reports full of traffic and engagement data face increasing skepticism from clients who are asking harder questions about incremental revenue growth.
- CMOs who need to defend budget allocation against CFO scrutiny are often armed with data that proves activity occurred, not that marketing caused growth.
The research report cites Airbnb and Uber as the clearest case study in attribution over-credit: both companies reduced or paused performance marketing spend and saw no significant drop in bookings or acquisitions. Attribution had been crediting paid spend for organic and brand-driven conversions that were going to happen anyway. That is a systemic problem, not an edge case.
The Data: Vanity Metrics vs. Incremental Impact Metrics
The following table maps the most common vanity metrics to the incremental impact metrics that replace them, based on the measurement framework outlined in the research report.
| Vanity Metric | What It Actually Measures | Incremental Replacement | What It Measures Instead |
|---|---|---|---|
| Organic Traffic | Volume of visits (incl. 51% bots) | Branded Demand Growth | New branded searches over time |
| Keyword Rankings | SERP position (≠ clicks or revenue) | Share of AI-Cited Content | Brand presence in AI-generated answers |
| ROAS | Blended attributed revenue ratio | Incremental ROAS (iROAS) | Revenue that would not exist without the ad |
| Click-Through Rate | Ad or content clicks | Incremental Conversions | Conversions caused by specific marketing activity |
| Cost Per Click | Media efficiency | Margin-Adjusted CAC | Customer acquisition cost vs. customer LTV |
| Session Count | Website visits | Genuinely Engaged Sessions | Sessions with meaningful interaction depth |
| Social Engagement Rate | Likes, shares, comments | Pipeline Influence | Marketing touchpoints in closed deals |
Real-World Performance Benchmarks
The research report documents the following outcomes from organizations that shifted to incremental measurement and integrated marketing strategies:
| Organization | Strategy Shift | Reported Outcome |
|---|---|---|
| Avianca Airlines | Digital audit of SEM, Social, Programmatic | $60M+ revenue unlocked; $2.5M waste eliminated |
| CNN Brasil | Organic content and search strategy | 91% pageview increase, surpassing 1B in 2022 |
| Adobe | Integrated SEO + product launch | 648% increase in first-page rankings; 25,200+ downloads |
| Western Union | Integrated content + Digital PR | 487% increase in organic search share of voice |
| Levi’s | Meta Advantage+ Shopping campaigns | 38% improvement in efficiency and ROAS |
These are not outlier results from companies with unlimited budgets. They are the documented outcomes of replacing activity reporting with impact measurement and building integrated strategies around genuine business objectives.
Step-by-Step Tutorial: How to Rebuild Your Marketing Measurement Stack
This is the practical walkthrough for auditing your current metrics and replacing misleading KPIs with a layered measurement approach. You can execute this across a 4-6 week sprint.
Phase 1: Audit Your Current Metric Stack (Week 1)
Step 1: List every metric you report on monthly.
Pull your standard marketing report and write down every single metric that appears. Do not filter yet — just list them. Typical stacks include organic sessions, new users, keyword rankings, email open rate, CTR, CPC, ROAS, social followers, engagement rate, and cost per lead.
Step 2: Apply the “causality test” to each metric.
For each metric on your list, ask two questions:
1. If this number improves, does revenue increase?
2. Can marketing directly cause this number to move?
A metric that fails question 1 is a vanity metric. A metric that fails question 2 is an environmental metric — useful for context but not for optimization. Organic traffic fails question 1 frequently (see: the bot traffic problem). Keyword rankings often fail question 2 in the AI-summary era.
Step 3: Identify what is missing.
Look specifically for these gaps:
– No incrementality measurement (you have ROAS but not iROAS)
– No branded demand tracking (you track branded keyword traffic but not branded search volume growth)
– No customer lifetime value in the acquisition cost calculation
– No channel-agnostic revenue attribution (Marketing Mix Model)
Document the gaps. You will fill them in Phase 2 and 3.
Phase 2: Implement Branded Demand Measurement (Week 2)
Branded demand growth is one of the most reliable leading indicators of marketing health. It measures whether your marketing is generating net-new interest in your brand, not just capturing it.
Step 4: Set up branded search volume tracking.
Use Google Search Console to pull branded query impressions over rolling 12-month periods. Do not look at clicks — look at impressions and query volume. This tells you whether more people are searching for your brand name, which reflects genuine demand generation from upper-funnel activity.
Step 5: Track brand presence in AI-generated answers.
Manually audit (or use a tool like BrightEdge or Semrush’s AI overview tracking) how often your brand or content is cited in Google AI Overviews, Bing Copilot answers, and ChatGPT responses. Set a baseline in month one. This metric will become critical as zero-click discovery accelerates — your brand can influence buyers through AI-cited content without it appearing in any traffic report.
Step 6: Measure “Search Everywhere” presence.
Per the research report, Google is no longer the sole discovery engine. Build a lightweight monthly audit that checks your brand’s discoverability across:
– YouTube (channel subscribers, video impressions)
– TikTok (profile views, search appearances)
– LinkedIn (company page impressions, organic post reach)
– Amazon / App Store (if applicable)
– AI engines (ChatGPT, Perplexity, Claude)
This is not about vanity metrics on each platform — it is about documenting whether your brand appears when buyers are actively researching in your category.
Phase 3: Run Your First Incrementality Test (Weeks 3-4)
Incrementality testing is the practice of measuring whether a specific marketing activity caused an outcome that would not have happened otherwise. It is the single most effective way to challenge over-credited attribution.
Step 7: Choose one channel to test first.
Start with your highest-spend performance channel — typically Google Ads branded search, Meta retargeting, or email reactivation. These channels are most likely to be claiming credit for conversions that are organic or brand-driven.
Step 8: Design a holdout test.
A holdout test involves randomly splitting your target audience into two groups:
– Test group: receives the marketing intervention (sees the ad, gets the email)
– Control group (holdout): does not receive the intervention
The size of the holdout group depends on your conversion volume. For statistical significance, you generally need at least 200-300 conversions in each group. For low-volume channels, run the test for 4-6 weeks minimum.
Step 9: Calculate incremental lift.
After the test period:
Incremental Conversion Rate = (Test Group CVR) - (Control Group CVR)
Incremental Conversions = Incremental CVR × Test Group Size
Incremental Revenue = Incremental Conversions × Average Order Value
iROAS = Incremental Revenue / Ad Spend
If your standard ROAS was 4x but your iROAS is 1.2x, you have just discovered that most of your attributed revenue was coming in anyway. That is the Airbnb/Uber finding applied to your specific channel. The research report documents that approximately 47% of marketers lack confidence in their attribution models — this test will tell you whether your skepticism is warranted.
Step 10: Present findings to leadership.
Frame the incrementality results in the language executives care about: “Without this spend, we would have lost X conversions and $Y in revenue.” This is the difference between proving activity occurred and proving marketing caused growth — the exact distinction the research report identifies as the core requirement for executive-level credibility.
Phase 4: Build a Layered Measurement Framework (Weeks 5-6)
The research report is explicit that relying on a single dashboard is no longer sufficient. High-growth organizations use a three-layer measurement approach.
Step 11: Layer 1 — Marketing Mix Modeling (MMM)
MMM uses statistical regression to estimate the contribution of each marketing channel to revenue, controlling for external factors like seasonality and economic conditions. This is your strategic budget allocation tool. You do not need a $500K agency engagement to get started — tools like Meridian (Google’s open-source MMM) and Robyn (Meta’s open-source MMM) allow in-house teams to run models with historical spend and revenue data.
Run MMM quarterly, not monthly. It is for portfolio-level decisions (should we shift budget from paid search to video?) not week-to-week optimization.
Step 12: Layer 2 — Incrementality Testing
This is your tactical validation layer. Run incrementality tests on every major channel at least once per quarter. Rotate through channels systematically so that within 12 months you have a tested iROAS for every significant line item in your media plan.
Step 13: Layer 3 — Attribution for Day-to-Day Optimization
Attribution models are not useless — they are just misused. Use last-touch or data-driven attribution for day-to-day campaign optimization (which ad creative is performing, which keywords to pause, which audience segments to expand). Do not use attribution to make budget allocation decisions. That is what MMM and incrementality testing are for.
Step 14: Build your executive dashboard.
Replace your vanity metric dashboard with a condensed executive view containing:
– Branded search volume trend (MoM, YoY)
– Incrementally proven revenue by channel
– LTV:CAC ratio by acquisition cohort
– AI citation coverage (qualitative + quantitative)
– Pipeline influenced by marketing (for B2B)
This dashboard answers the question executives actually ask: Did marketing cause growth?
Expected Outcomes
Within 90 days of completing this audit and rebuild, you should expect:
– At least one channel where attributed ROAS significantly overstated incremental value (this is nearly universal)
– A clearer budget reallocation case to shift spend toward channels with proven incremental lift
– A marketing report that executives engage with rather than skim
Real-World Use Cases
Use Case 1: E-Commerce Brand Discovering Brand Keyword Waste
Scenario: A direct-to-consumer apparel brand spends $40K/month on branded paid search. Their ROAS on branded keywords is 12x — which looks like their most efficient channel.
Implementation: They run a 30-day holdout test, pausing branded search ads for a 30% audience segment. Conversion rates in the holdout group drop by only 8% relative to the test group.
Expected Outcome: The incremental lift from branded search is 8%, not 100%. The 12x ROAS was almost entirely capturing organic demand. They reallocate 60% of branded search spend to YouTube upper-funnel creative, which tests positive for incrementality in the next quarter. This mirrors the documented Levi’s result — a 38% improvement in ROAS efficiency after shifting to an integrated measurement approach.
Use Case 2: B2B SaaS Company Replacing Ranking Reports
Scenario: A SaaS company’s SEO team reports 47 first-page keyword rankings as their primary success metric. The VP of Marketing is questioned by the CFO about what those rankings are worth.
Implementation: The team sets up branded search volume tracking in Google Search Console and adds a quarterly audit of brand mentions in ChatGPT and Perplexity answers for their category’s key queries. They also track the percentage of inbound demo requests that list “Google search” as the discovery source.
Expected Outcome: Rankings become a leading indicator, not the headline metric. The team discovers their brand is cited in AI-generated answers for 3 high-value category queries that drive zero tracked clicks — but those citations are influencing buyers before they ever reach the site. This aligns with the research report’s finding that brands can influence buyers through AI-cited content without it appearing in traffic reports.
Use Case 3: Agency Rebuilding Client Reporting
Scenario: A digital marketing agency presents monthly reports showing traffic, CTR, and ROAS to a retail client. The client is asking harder questions about actual sales impact. The relationship is at risk.
Implementation: The agency implements the three-layer measurement framework for the client — running an MMM with 18 months of historical spend data, designing incrementality tests for the two top-spend channels, and replacing the traffic dashboard with a branded demand + incremental revenue view.
Expected Outcome: The agency surfaces $2.1M in misattributed spend — ad budget that was claiming credit for sales that were organic. They redirect that budget to upper-funnel video, which tests incrementally positive. Client retention secured. This pattern mirrors the Avianca Airlines case study, where a digital audit unlocked over $60M in revenue and eliminated $2.5M in waste.
Use Case 4: Content Team Optimizing for AI Discovery
Scenario: A media brand’s organic traffic is declining despite maintaining strong keyword rankings. Their content team is unsure why.
Implementation: They audit their SERP click-through rates for their top 50 keywords and find that 60% of those queries now trigger AI Overviews. Per the research report, users click through at half the rate when encountering an AI summary — which explains the traffic decline that rankings alone do not show. The team restructures content to be citation-friendly for AI answers: clear factual statements, data-backed claims, and structured formatting that AI can lift and attribute.
Expected Outcome: Over 6 months, the brand tracks a measurable increase in AI Overview citations. Direct traffic and branded searches grow as AI-cited content builds awareness — demonstrating the research report’s point that measurement must evolve to capture invisible influence, not just tracked clicks.
Common Pitfalls
Pitfall 1: Replacing one vanity metric with another
Teams often audit their metrics, identify ROAS as misleading, and replace it with a new single number like “revenue per user.” The problem is the same: a single metric never tells the full causal story. The fix is a layered framework (MMM + incrementality + attribution), not a metric swap.
Pitfall 2: Running incrementality tests that are too short
A two-week holdout test for a channel with 50 monthly conversions will produce statistically meaningless results. You need at minimum 200-300 conversions in each group. If your conversion volume is low, run tests for 8-12 weeks, or test at a higher funnel stage (leads instead of purchases). Underpowered tests produce false confidence.
Pitfall 3: Using MMM for week-to-week decisions
Marketing Mix Models are built on long-horizon data — typically 18-36 months of spend and revenue history. They are not designed to tell you whether to pause a campaign this Tuesday. Using MMM outputs at a tactical level is a misapplication that leads to incorrect optimizations. Keep MMM at the quarterly strategic layer.
Pitfall 4: Ignoring the 51% bot traffic problem
If you are running display or programmatic campaigns and measuring engagement rate or session quality without filtering bot traffic, you are optimizing against noise. Per the research report, 51% of all web traffic is non-human. Audit your analytics setup to confirm bot filtering is active and your engaged session definition excludes sub-5-second visits.
Pitfall 5: Reporting AI citation presence without defining the methodology
“We appear in ChatGPT answers” is not a metric. Before you start tracking AI citation coverage, define: which queries, which AI tools, which geographic markets, what constitutes a citation vs. a mention, and how often you audit. Without a repeatable methodology, this becomes a vanity metric dressed in new clothes.
Expert Tips
Tip 1: Run a brand dark period test once per year. Pause all branded paid search for 2-4 weeks in a low-stakes period and measure organic conversion rate change. This is the single fastest way to determine what percentage of your branded spend is incremental. Most brands that run this test for the first time discover they can cut 40-60% of branded search spend without measurable revenue impact.
Tip 2: Use iROAS thresholds, not ROAS targets, for budget scaling decisions. Set a minimum iROAS threshold (e.g., 1.5x) below which you do not scale spend, regardless of what attributed ROAS shows. Per the research report, a 4x blended ROAS can hide a marginal return of 0.5x on the last dollars spent — meaning you are actively destroying value at the margin while the blended number looks healthy.
Tip 3: Segment your traffic quality before optimizing for volume. Using Google Analytics 4, create a custom segment for “engaged sessions” (30+ seconds, 2+ page views, or key event triggered). Report on engaged session growth rather than total sessions. This immediately filters the 51% bot traffic problem and the 21% short-session problem from your optimization decisions.
Tip 4: Align your marketing dashboard to the CFO’s metrics, not the marketing team’s. Per the research report, 92% of marketers cite profit as a primary metric but report on rankings that only 18% of executives value. Build a parallel executive view of your dashboard that speaks in margin, LTV:CAC, and payback period. Use this version in budget reviews, not the operational dashboard.
Tip 5: Treat “Search Everywhere” optimization as a distinct content workstream. The research report documents that buyers evaluate brands on YouTube, LinkedIn, and AI engines before visiting your site. This is not a social media strategy — it is a discovery strategy. Assign specific team members ownership of YouTube SEO, LinkedIn thought leadership, and AI citation optimization as separate, measured workstreams with their own KPIs.
FAQ
Q: How do I convince my team to change metrics they are already hitting targets on?
A: The easiest path is the incrementality test. Run it alongside your existing reporting — do not replace anything yet. When the test reveals that attributed ROAS is 4x but iROAS is 1.1x, the data makes the case for you. Picking a fight over dashboards is hard. Showing that the current spend is not generating incremental revenue is a CFO-level argument that lands.
Q: Is Marketing Mix Modeling only viable for large enterprises?
A: No. Google’s open-source Meridian MMM and Meta’s Robyn are free tools that in-house analysts can run with standard Python or R skills. You need 18+ months of weekly spend data and revenue data by channel. Mid-market companies with $2M+ in annual marketing spend can run a useful MMM without an agency engagement.
Q: How do I measure the impact of content that influences buyers in AI engines but never generates a click?
A: You measure it through branded demand, not traffic. Per the research report, brands can influence buyers through AI-cited content without it appearing in traffic reports. The signal that this is working is growth in branded search queries, direct traffic, and the proportion of deals where the prospect already knows who you are at first contact. AI citation audit tools are emerging, but branded demand metrics are the most reliable proxy today.
Q: What is the right holdout size for an incrementality test?
A: Target 20-30% of your total addressable audience as the holdout group. This is large enough to generate statistical significance without sacrificing too much potential revenue during the test period. For conversion rates below 1%, increase the holdout size or extend the test duration. The goal is 200-300 conversions per group minimum before drawing conclusions.
Q: Should I stop reporting on organic traffic entirely?
A: No — but stop reporting on raw session volume as a primary metric. Use organic traffic as a diagnostic tool (is something broken?) rather than a success indicator. Replace it in your headline metrics with branded demand growth (branded search volume trend) and engaged session rate (engaged sessions as a percentage of total). These two metrics together tell a more accurate story about whether your content and SEO work is generating real business value.
Bottom Line
The core problem with most marketing reports is not that the data is wrong — it is that the metrics were designed to measure activity in a world where activity correlated reliably with business outcomes. That correlation has broken down. Per the research report, 51% of traffic is bots, 26% of users leave after an AI summary without visiting any site, and attribution models are crediting channels for conversions that were happening organically. The organizations pulling ahead — the Aviancas, Adobes, and Western Unions documented in the research — are the ones that replaced activity metrics with causality metrics: incrementality testing, Marketing Mix Modeling, branded demand tracking, and LTV-adjusted acquisition costs. This is not a measurement philosophy shift. It is a competitive advantage. Every quarter you continue reporting on rankings and blended ROAS is a quarter your competitors who have made this transition are reallocating budget with better information than you have. The playbook is documented. The tools are free or low-cost. The only thing required is the decision to measure what actually matters.


0 Comments